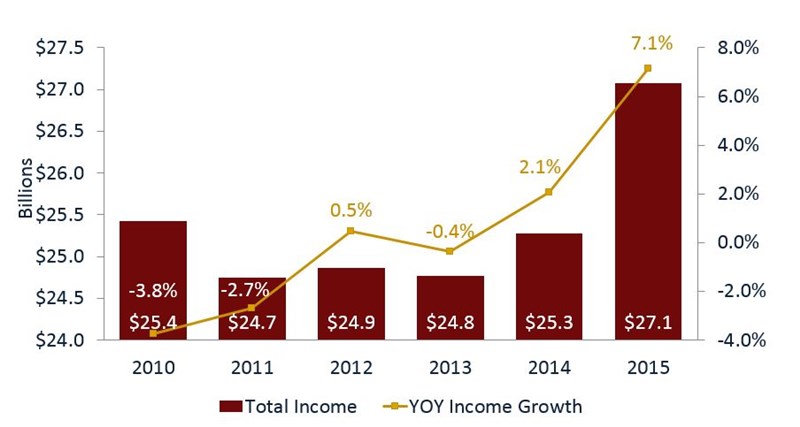
Steady rates on investments and loans haven’t stopped credit unions from increasing their total income 7.1% year-over-year. In the first half of 2015, total income at America’s credit unions reached $27.1 billion.
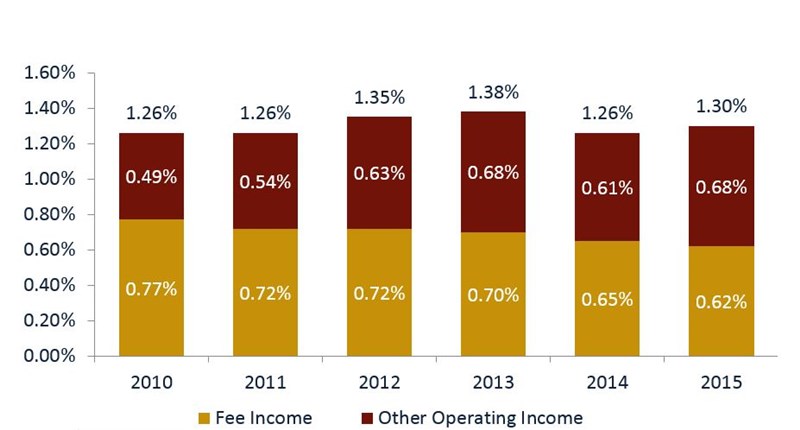
As a percent of total income, fee income declined 60 basis points year-over-year. This indicates credit unions are reducing fees and earning income through other sources like mortgage sales to the secondary market, which grew 80.0% year-over-year. The percentage of these sales compared to total first mortgage originations also increased from 32.0% in June 2014 to 38.9% in June 2015.
1. The 7.1% YOY growth in income is largely the result of increased lending.
Year-to-date total loan originations reached $200.2 billion as of second quarter 2015.
Total Income And Year-Over-Year Income Growth
For all U.S. credit unions | Data as of 06.30.15
Callahan & Associates | www.creditunions.com
Source: Peer-to-Peer Analytics by Callahan & Associates
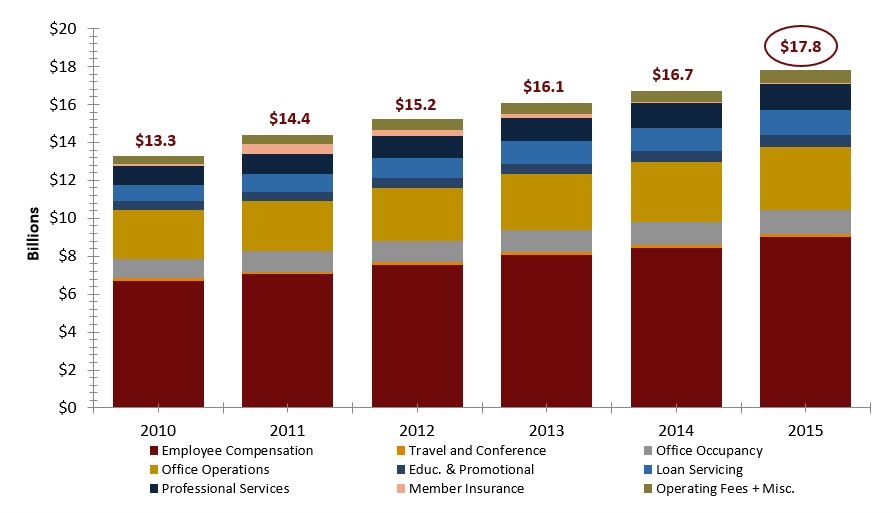
2. Operating expenses rose 5.6% in 2015.
As per usual, employee compensation and benefits were a significant variable in the income statement. As of midyear 2015, they were responsible for half of all operating expenses.
Operating Expense Composition
For all U.S. credit unions | Data as of 06.30.15
Callahan & Associates | www.creditunions.com
Source: Peer-to-Peer Analytics by Callahan & Associates
3. Fee income is down; other operating income is up.
Fee income as a percentage of average assets is down three basis points from 12 months ago whereas other operating income as a percentage of average assets increased seven basis points. The latter now makes up 14.9% of total income at credit unions.
Non-Interest Income As A % Of Average Assets
For all U.S. credit unions | Data as of 06.30.15
Callahan & Associates | www.creditunions.com
Source: Peer-to-Peer Analytics by Callahan & Associates
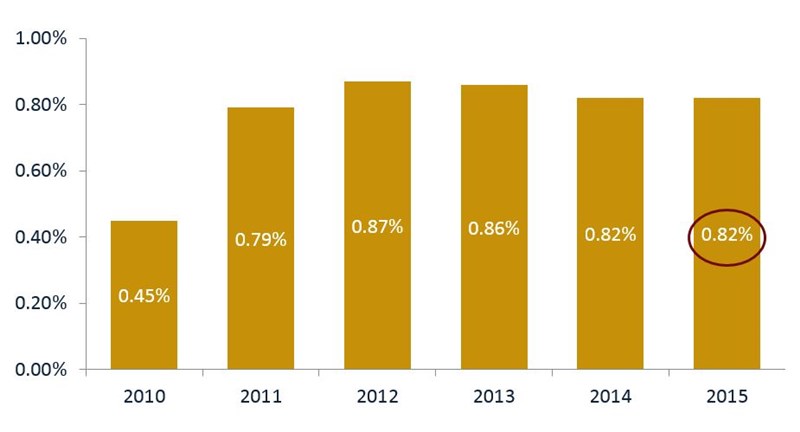
4. Net income grew, but ROA remains flat.
Net income grew 3.9%, but the 6.0% year-over-year increase in assets to $1.2 trillion resulted in ROA remaining flat at 0.82%.
Return On Assets
For all U.S. credit unions | Data as of 06.30.15
Callahan & Associates | www.creditunions.com
Source: Peer-to-Peer Analytics by Callahan & Associates
Visit CreditUnions.com for quarterly performance analysis not available anywhere else.