Auto Lending By The Numbers (4Q 2016)
Credit unions captured 18.0% of the auto lending market in the fourth quarter. That’s an increase over one year ago. Where is that growth coming from?
Credit unions captured 18.0% of the auto lending market in the fourth quarter. That’s an increase over one year ago. Where is that growth coming from?
Core deposits at credit unions surpassed $800 billion at year-end. Which shares underpinned this growth?
ROA increased 2 basis points for credit unions nationally, but where do the high and low performers fall?
Cybersecurity is a leadership issue but requires action from the entire enterprise.
What electronic services do credit unions offer?
Low-income credit unions from 41 states, the District of Columbia, Puerto Rico, and the Virgin Islands received grant awards last year. How much did they receive? And where did the money go?
Lending, savings, community support, and more. Credit unions had a busy year.
Which states rank top in the nation for credit union auto loan originations?
Credit unions originated $343.6 billion through third quarter 2016 — that’s an all-time record. See which areas contributed to this double-digit year-over-year growth.
If credit unions continue on their current path, will they be able to fund future loans solely through share growth?

This year’s finalists are reimagining how credit unions use data to boost service levels and improve efficiencies.

In order to adopt a more proactive strategy, the Iowa cooperative is using a dedicated product development team to promote visibility and follow-through from idea to launch.

This year’s finalists are reimagining how credit unions can use AI to combine cutting-edge technology with old-school member service.

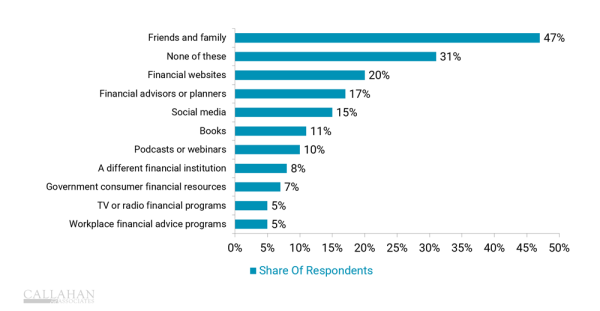
Financial advice comes in many forms. How can credits union make sure they are the No. 1 choice for their members?

This year’s finalists are uncovering new ways to harness the power of technology to improve and expand lending across the industry.

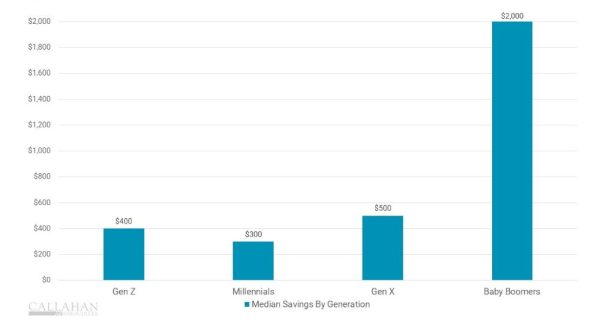
A program to help staffers improve their savings skills generated more than $200,000 in deposits and helped change participants’ financial habits.

As Super Bowl LX nears, the Callahan Bowl prediction model says the Seahawks will see green en route to the Lombardi Trophy.

Lending is evolving, and credit unions are adapting. This week, CreditUnions.com examines how shifting economic conditions are reshaping lending strategies.

Affordability pressures, extended loan terms, and shifting vehicle values are forcing institutions to look beyond familiar structures and reconsider how to balance risk and return.

Credit unions are uniquely well-positioned to guide members through uncertainty and fill essential funding gaps.