4 Ways The Sand States Have Dusted Themselves Off
Hard hit during the recession, the Sand States kickoff 2015 with a return to growth.
Hard hit during the recession, the Sand States kickoff 2015 with a return to growth.
Today, 40% fewer credit unions offer member insurance than in 2011. That’s an opportunity for credit unions to offer members a dependable product and peace of mind.
Millennials and new organizational structures are shaping the credit union industry for today and tomorrow.
Credit unions face the reality of a merger every year, so how are mergers reshaping the credit union landscape?
How would a bump in interest rates affect investments at U.S. credit unions?
This Graphic Of The Week offers five reasons to start benchmarking today and three strategies to make the most of benchmarking efforts.
Credit unions demonstrate a commitment to add numbers to their employee rosters and dollars to their employee salaries.
Marketing expenses, measurable goals, and more in this Graphic Of The Week.
Homeownership rates, origination volume, market share, and more in this Graphic Of The Week.
As a way to get rich quick, fraudsters are using payment card skimming devices to target the financial services industry.

This year’s finalists are reimagining how credit unions use data to boost service levels and improve efficiencies.

In order to adopt a more proactive strategy, the Iowa cooperative is using a dedicated product development team to promote visibility and follow-through from idea to launch.

This year’s finalists are reimagining how credit unions can use AI to combine cutting-edge technology with old-school member service.

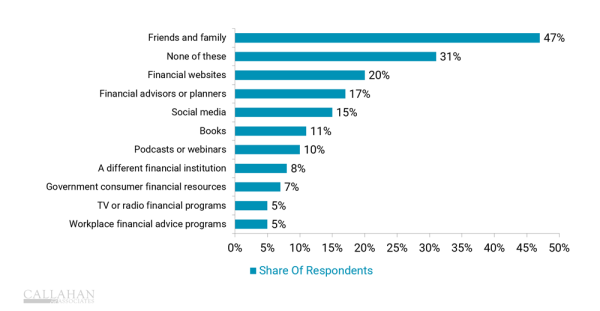
Financial advice comes in many forms. How can credits union make sure they are the No. 1 choice for their members?

This year’s finalists are uncovering new ways to harness the power of technology to improve and expand lending across the industry.

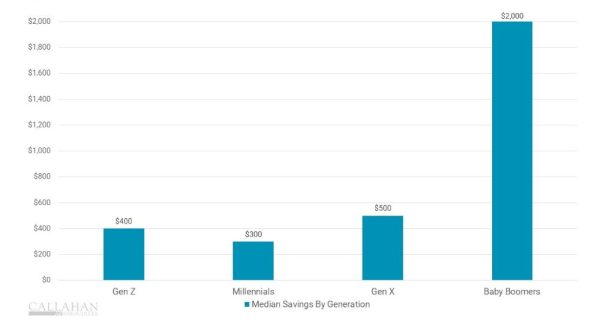
A program to help staffers improve their savings skills generated more than $200,000 in deposits and helped change participants’ financial habits.

As Super Bowl LX nears, the Callahan Bowl prediction model says the Seahawks will see green en route to the Lombardi Trophy.

Lending is evolving, and credit unions are adapting. This week, CreditUnions.com examines how shifting economic conditions are reshaping lending strategies.

Affordability pressures, extended loan terms, and shifting vehicle values are forcing institutions to look beyond familiar structures and reconsider how to balance risk and return.

Credit unions are uniquely well-positioned to guide members through uncertainty and fill essential funding gaps.