Credit unions delivered exceptional value to members in second quarter 2018 across a host of metrics. Read on to learn the full story.
Macro Economic Trends
The Economy Soars; Housing Stagnates
-
June marked the 110th consecutive month of economic expansion.
-
The threat of tariffs in the run-up to the end of the second quarter appeared to boost exports.
-
Sales of new and existing homes have been flat over the past six months.
By most popular measures, the U.S. economy is humming along. June marked the 110th consecutive month of economic expansion, and the Bureau of Economic Analysis revised up its second quarter GDP estimate from its initial 4.1% to an annual rate of 4.2%. This is the best GDP performance since the third quarter of 2014.
Numerous positives can be gleaned from the performance of the underlying components of GDP. Personal consumption of both goods and services contributed 21% and 47%, respectively, to total GDP. Business segments added another 18%.
CONTRIBUTION OF COMPONENTS TO REAL GDP GROWTH
DATA AS OF 06.30.18
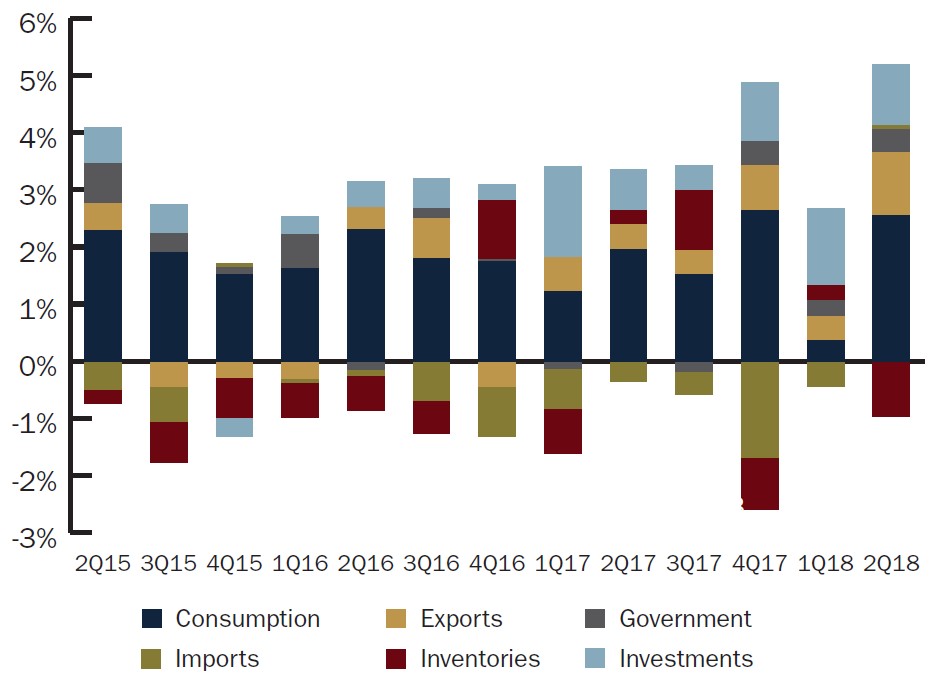
Personal consumption of both goods and services contributed 2.55 percentage points to real GDP growth in the second quarter of 2018.
Source: Federal Reserve of St. Louis.
Exports recorded the largest positive contribution since the fourth quarter of 2013 and made an outsized impact on GDP in the second quarter, contributing 1.06% of the 4.2% growth. On a year-over-year basis, exports increased 5.7%. The threat of tariffs in the run-up to the end of the second quarter appeared to boost exports. The food, feed, and beverages export line item increased $29 billion from March 31, 2018. For comparison, exports for this segment grew $5.5 billion and $4.3 billion over the same period in 2017 and 2016, respectively.
ContentMiddleAd
Read the full analysis or skip to the section you want to read by clicking on the links below.
INDUSTRY AT-A-GLANCE BALANCE SHEET: ASSETS LENDING ASSET QUALITY INVESTMENTS BALANCE SHEET: LIABILITIES SHARES LIQUIDITY MANAGEMENT NCOME STATEMENT MEMBER ENGAGEMENT
Inventories contracted in the second quarter and subtracted a full percentage point from what would have been a GDP of 5.2%,. Economists predict consumer demand will eventually prompt businesses to replenish depleted inventories and contribute to additional GDP growth in the coming quarters. However, this segment is prone to swings 16 of the past 20 quarters have fluctuated 0.5% or more so the potential exists for companies to stay lean and continue running off their inventories.
Consumer spending, which accounts for roughly two-thirds of total U.S. economic activity, rose to an annual rate of 3.8% in the second quarter. That’s up from the first quarter’s modest pace of 0.5%. The majority of growth in consumer spending came from restaurants and accommodations, and as consumer demand has increased, prices have finally, albeit stubbornly, followed suit.
The Fed’s preferred measure of inflation, the Core Personal Consumption Expenditure Index (Core PCE), rose 0.1% in June right on the heels of a 0.2% increase in May. On an annual basis, however, Core PCE has held steady at 1.9% for three straight months. This is just below the Fed’s 2.0% inflation target. By excluding the more volatile components of food and energy, Core PCE is considered to be a more stable measure of inflation, and, overall, price increases have lagged below the central bank’s target for the past six years.
The national unemployment rate flirts with record lows. It finished June at 4.0%, which is up only slightly from May’s 18-year record low of 3.8%. This increase is largely attributed to the approximately 600,000 workers that re-entered the job market in June. In total, the U.S. economy added 213,000 new jobs in June, which indicates there is a sustained demand from businesses despite a diminished pool of skilled workers.
As businesses expand and the demand for skilled labor grows, employee compensation also begins to move higher. Wages and salaries rose 0.5% in the second quarter. Although this was slower than the first quarter’s rise of 0.9%, overall, wages and salaries were up 2.8% year-over-year. This is the largest annual gain in wage growth since the third quarter of 2008.
Homebuying remains a weak spot in the broader economy. Despite home price appreciation, growth appears to be easing nationally. Sales of new and existing homes have been flat over the past six months. According to the S&P CoreLogic Case-Schiller Indices, the 6.2% year-over-year increase in June was down from a 6.4% annual gain in May. Much of the price appreciation is attributed to inventory constraints, particularly at the entry level.
Western markets reported the largest increase in home prices. Las Vegas reported the largest annual gain, 13.0% from June 2017. Seattle and San Francisco followed closely behind at 12.8% and 10.7%, respectively. Conversely, Northeastern and Midwestern markets reported slower home price appreciation. This is because of cooler housing markets and a larger supply of homes coming onto the market, among other reasons.
CONSUMERS WHO THINK HOMEBUYING CONDITIONS ARE POOR

Barriers to entry are causing consumers to report an increasing hesitation to purchase homes.
Source: University of Michigan.
According to the most recent data from the University of Michigan’s consumer sentiment survey regarding homebuying, consumer attitudes appear to be softening. The percentage of respondents who felt it was a bad time to buy a house held steady at 29.0% for the second straight quarter. This second quarter reading was up from a recent low of 18.0% in the second quarter of 2015 but marked the highest level since the fourth quarter of 2008. University of Michigan economist Richard Curtin cited less favorable perceptions of market prices and interest rates as driving factors.
Monetary policy is on cruise control for the time being as the Fed pairs gradual interest rate normalization with clear and consistent market communication. As a result, hikes in the Fed funds rate for the remainder of 2018 have been almost unanimously priced into futures contracts by the market. Economists forecast an additional three increases for 2019, whereas the futures contracts are currently priced for 1.5 hikes. The increases in Core PCE and GDP combined with modest wage growth give credence to Fed officials to stay the course for the rest of 2018’s planned rate hikes.
Credit Union Trends
Industry At-A-Glance
Top-Level Takeaways
-
The total number of credit unions dropped by 50 in the second quarter.
-
Nationally, 97.6% of the industry met the NCUA’s 7.0% well-capitalized threshold.
-
Membership expanded 4.3%, the equivalent of 4.7 million new members.
There were 3,444 federally chartered and 2,152 state-chartered credit unions as of June 30, 2018. The total number of actively operating credit unions 5,596 was 50 fewer than as of March 31. On an annual basis, the number of institutions declined by 219, which is in line with recent consolidation trends.
Aggregate assets for the industry expanded 5.8%, or $79.5 billion, from the second quarter of 2017. Outstanding loan balances increased 9.7% year-over-year and surpassed $1.0 trillion for the first time on record. The average loan balance for the industry was $15,229 as of June 30; that’s up 4.1% from $14,624 one year ago. Investment and cash balances declined 3.8% year-over-year as credit unions allowed investments to roll-off to fund a continued robust loan demand that is fueled by elevated consumer confidence and a growing economy.
From a deposit perspective, total shares increased 5.4%, or $62.6 billion, annually. This is down from the 5.6% growth the industry recorded in the first quarter of the year and significantly lower than the 8.1% growth recorded one year ago. As the economy churns along, consumers are increasingly shirking savings products and opting for higher yielding returns in the stock market.
INDUSTRY OVERVIEW
FOR U.S. CREDIT UNIONS | DATA AS OF 06.30.18
Callahan & Associates | www.creditunions.com
| Data As Of 06.30.18 | 12-Month Growth (2Q18) | 12-Month Growth (2Q17) | |
|---|---|---|---|
| Assets | $1.4T | 5.8% | 7.6% |
| Loans | $1.0B | 9.7% | 10.8% |
| Shares | $1.2T | 5.4% | 8.1% |
| Investments | $359.6B | -3.8% | 1.7% |
| Capital | $162.6B | 6.4% | 5.7% |
| Members | 115.4M | 4.3% | 4.3% |
Balance sheet growth for credit unions remained strong even as investment and cash balances declined as credit unions rolled-off investments to fund the robust loan demand.
The growth differential between loan and share balances pushed the loan-to-share ratio to 82.9% in the second quarter of the year. That’s up almost 3.3 percentage points from one year ago and is approaching the 83.1% high hit in the fourth quarter of 2008.
Revenue dynamics remained strong across the industry. Total operating income was up 13.1% annually, and the increases in the federal funds rate began to impact credit unions’ income statements as repriced loans translated to widening loan yields and growth in interest income.
Net income for the industry grew 24.5% on a year-over-year basis, and the average ROA was up 13 basis points from one year ago to 0.90% as of June 30, 2018. Net income gains translated to higher capital levels at credit unions across the country as total net worth grew 7.9% to $159.3 billion. The average net worth ratio for the industry has increased 22 basis points over the past 12 months to 11.0% as of June 30. Nationally, 97.6% of the industry met the NCUA’s 7.0% well-capitalized threshold at midyear.
Integral to this growth is an expanding member base. In the past 12 months, membership at U.S. credit unions expanded 4.3%. This equates to more than 4.7 million new members and marks the eighth consecutive quarter of member growth higher than 4.0%.
Balance Sheet: Assets
-
Sales to the secondary market fell to 30.6% at midyear.
-
Total delinquency decreased 8 basis points year-over-year; most major loan segments recorded improved asset quality.
-
The average yield on investments hit the highest level since the all-time high of fourth quarter 2010.
Balance sheets at credit unions across the country are shifting as the broader United States economy continues to grow. Loan growth remained robust in the second quarter while key fundamentals and asset quality improved.
Loans
Credit unions recorded strong but slowing asset growth in the second quarter of 2018. Loan origination growth accelerated to an annual rate of 6.2%. That’s up from a recent low of 3.7% in the first quarter but weaker than the 9.7% recorded one year ago.
Robust demand for auto loans helped push non-real estate secured consumer loans higher. Expanding 8.2%, year-to-date originations for this segment totaled $166.5 billion through June 30. Consumer originations accounted for 65.4% of total originations at credit unions through the second quarter of 2018.
YTD LOAN ORIGINATIONS AND ANNUAL GROWTH
FOR U.S. CREDIT UNIONS | DATA AS OF 06.30.18

Loan origination totals crept higher for the fourth year in a row.
Source: Callahan & Associates.
First mortgage annual origination growth fell 5.2 percentage points from June 30, 2017, to 2.1% as of midyear 2018. In lockstep with rising interest rates, the average rate increased year-over-year for all three major mortgage types.
According to data from Freddie Mac, the average rate for a 30-year fixed rate mortgage was 4.6% in the second quarter of 2018. That’s an increase of 67 basis points annually and is the highest average rate for a 30-year fixed-rate mortgage since 2010. The average rate for a 15-year fixed-rate mortgage was 4.0%, and the average rate for a five-year ARM was 3.8%.
As rates have changed, so, too, have borrowers’ loan preferences. Consumers are increasingly selecting mortgage products with adjustable features. Fixed-rate first mortgages accounted for 64.2% of total first mortgage originations at midyear; however, the share of adjustable products has gradually increased from 28.3% in the second quarter of 2015 to 35.8% as of June 30, 2018.
Credit union behavior has also changed. Credit union sales of first mortgage originations to the secondary market have declined over the past several years as the industry increasingly holds more adjustable rate products to hedge against interest rate risk. As a percentage of total first mortgage originations, sales to the secondary market have fallen from a recent high of 40.5% in the third quarter of 2016 to 30.6% as of midyear 2018.
Total outstanding loans on the balance sheets of credit unions across the country increased at a healthy annual pace of 9.7%. However, this is still 1.1 percentage points slower than one year ago. First mortgages and credit card loans were the only segments to record accelerating growth over the past 12 months.
As noted already, rising rates are causing a shift in the origination portfolio. As a result, credit unions are holding more first mortgages in portfolio than in recent years. Accordingly, first mortgage balance sheet growth accelerated annually from 10.3% to 10.6% as of the second quarter of 2018.
Year-over-year credit card balance growth hit 9.1%. That’s a full percentage point faster than the rate reported one year ago. Credit card utilization for the industry increased 3 basis points annually to 31.2% at midyear as credit card balances grew at a slightly faster pace 9.1% than unfunded commitments 8.9%. Consumer confidence and attitudes toward short-term debt are improving, and credit unions must monitor this ratio to determine if members are drawing more on their lines of credit or simply opening new lines and keeping draws stable.
12-MONTH LOAN GROWTH
FOR U.S. CREDIT UNIONS | DATA AS OF 06.30.18

Total outstanding loans increased at a healthy annual pace; however, first mortgages and credit card loans were the only segments that recorded accelerating growth.
Source: Callahan & Associates.
Both new and used auto loans grew at impressive but slowing rates over the past 12 months. New auto loans expanded faster than used 11.7% versus 9.9%, respectively which continued a trend that started in 2012.
Much of the industry’s auto growth since the recession is the result of indirect lending. Balances from this channel have increased 150.8% in the past five years and totaled $212.8 billion as of June 30, 2018. By contrast, direct loans have increased 36.5% in the past five years and totaled $142.8 billion at midyear. Total auto loans have grown 87.7% in the past five years. Indirect lending accounted for 59.8% of the credit union auto portfolio at midyear; direct loans accounted for the remaining 40.2%.
Over the past 12 months, indirect loan balances have increased 16.4% and direct loan balances have increased 3.0%. For perspective, indirect loan balances have expanded at a double-digit rate since Dec. 31, 2012, whereas growth in direct loan balances has been in the single digits since June 30, 2015.
The indirect channel has also been a significant driver of member growth. Since midyear 2013, credit unions have added 5.9 million new members through indirect lending. That’s 31.2% of the industry’s 19.0 million net new members.
Despite the channel’s access to quick loans, significant competition and market headwinds remain. Credit unions that participate in indirect lending must evaluate product pricing and dealer compensation to ensure they are not only commensurate with market rates but also profitable for the originating institution. Although the indirect channel has proven to be a reliable avenue to fund loans, credit unions would be well served to evaluate their strategies to ensure they are converting indirect borrowers into engaged members benefiting from the cooperative model.
Asset Quality
Asset quality at credit unions across the country has improved over the past 12 months. Total delinquency decreased 8 basis points year-over-year to 0.67%. Every major segment of the loan portfolio, with the exception of credit cards, recorded improved asset quality.
First mortgage delinquency fell 4 basis points in the past year to 0.52% although that was up 9 basis points from the first quarter’s historical low of 0.43%. New and used auto delinquency fell 2 and 5 basis points, respectively, year-over-year. Despite fears of an automotive bubble, credit union performance in this segment appears sound. The NCUA started collecting data on auto loan delinquency in the second quarter of 2013. Since then, new auto delinquency has fallen 1 basis point and used auto delinquency has increased 5 basis points.
Credit card loan delinquency was the only major segment to increase over the past year. It notched up 7 basis points to 1.15%. However, that is still 14 basis points lower than its recent high of 1.29% at year-end 2017.
Charge-offs and recoveries have slightly increased over the past year. Net charge-offs for the entire portfolio rose 4 basis points year-over-year to 0.60% as of June 30. Similar to delinquency, every major segment posted year-over-year improvements in charge-offs. The lone exception was credit cards, where charge-offs increased 34 basis points.
Investments
Credit unions held $369.7 billion in investments and cash as of June 30, 2018. That’s down 5.1% from the first quarter of 2018 and 3.8% from the second quarter of 2017. The dip in total investments for the quarter followed past cyclical trends wherein growth in the first three months of the year is followed by a slight decline in the following three quarters.
HISTORICAL INVESTMENT COMPOSITION
FOR U.S. CREDIT UNIONS | DATA AS OF 06.30.18

Since the Great Recession, credit unions have shifted to holdings of agencies and cash balances at the Federal Reserve.
Source: Callahan & Associates.
The net $19.8 billion drop in investments and cash in the first quarter was largely a result of declining Fed balances and cash at corporate credit unions. The former dropped 18.2% quarterly, from $82.8 billion to $67.7 billion, and decreased its share of the portfolio 2.9 percentage points. The latter dropped 19.3% quarterly. It fell from $24.8 billion to $20.0 billion, and its share of the portfolio contracted 95 basis points. Collectively, agency MBS and debt remained the largest non-cash investment vehicles. They accounted for 59.3% of the portfolio, up 2.2 percentage points from March 31, 2018.
The average investment maturity for credit unions lengthened in the first quarter of 2018 as institutions reallocated shorter investments to fulfill loan demand. Cash and equivalents contracted 16.2% on a quarterly basis and fell from $123.2 billion in the first quarter to $103.2 billion as of June 30. This was largely the result of 18.2% and 19.3% declines in Fed and corporate cash balances, respectively.
The average yield on investments rose 13 basis points from the first quarter. It reached 1.92% as of June 30, 2018, which is the highest level since it hit 1.96% in the fourth quarter of 2010. Credit unions have benefited from the five rate hikes the Fed has implemented in the past 18 months. Economists project the Fed will raise rates at least one more time in 2018, with the markets echoing this sentiment as futures contracts are pricing in an additional hike in December 2018. Annualized credit union investment income expanded 3.7% quarterly and 21.4% annually, which drove yield on investments higher through the first half of 2018.
Balance Sheet: Liabilities
-
Nearly 2,500 credit unions have increased their share certificate interest rates in 2018.
-
The credit union industry loaned $26.5 billion more in the past 12 months than it took in via deposit channels.
-
Year-to-date participation sales grew 7.8% year-over-year to $5.1 billion.
Lagging deposit growth is putting pressure on credit union executives to think creatively about ways to bring in new deposits as well as how and when to reprice components of their balance sheets. With one more rate increase projected for 2018 and three more in 2019 liquidity management will be a key focus for cooperatives in the coming months.
Shares
Loan demand has moderated slightly in recent months; nevertheless, credit unions across the country face mounting liquidity pressures as deposit growth lags loan growth. In total, the share portfolio grew $62.6 billion, or 5.4%, in the past 12 months. The majority of that gain, 41.1%, came from regular share accounts. Savings account balances rose 6.5% year-over-year, which is slower than the 9.4% growth recorded from the second quarter of 2016 to the second quarter of 2017. Share drafts expanded at the fastest rate, 8.7%, and added $15.7 billion in balances.
12-Month Share Growth
FOR U.S. CREDIT UNIONS | DATA AS OF 06.30.18

As liquidity tightens, institutions raise rates. Certificate products were the only segment in the credit union share portfolio to record accelerating growth year-over-year.
Source: Callahan & Associates.
Consumers have a growing number of alternatives to garner the highest return for their money, which makes it more difficult for credit unions to capture deposits. Online lenders and national banks have raised savings rates throughout the year. To keep their deposits in the face of competition, credit unions must determine when, what, and how much to adjust deposit pricing as they chart the best path forward for members and margins.
For the moment, credit unions are not broadly repricing non-maturity deposit products, such as money market shares. Instead, they are introducing new or enhanced money market accounts that feature higher rates but also require larger minimum balances and have more restrictive parameters to access.
Certificate products were the only share segment whose growth accelerated over the past 12 months. Balances in that segment rose 7.2% to $222.0 billion as of June 30, 2018. For comparison, credit unions reported growth in certificate products of 4.6% in the second quarter of 2017.
Core deposits regular shares, share drafts, money market shares have driven most of the growth in the share portfolio since the Great Recession. Since the second quarter of 2012, core deposit balance growth has accounted for 92.1% of the gains in the industry’s deposit portfolio.
As the Federal Reserve raises the federal funds rate, credit unions are repricing their term deposits to remain competitive. Nearly 2,500 credit unions have increased their share certificate interest rates since year-end 2017, with an average upward adjustment of 34 basis points. Although there is always the risk that certificates will attract hot money from rate shoppers, every credit union should evaluate its funding sources both borrowed and member-funded to ensure they align with its business model and asset liability management policies.
Liquidity Management
Net liquidity change is the net difference between annual deposit growth and loan growth. As share growth slows, the industry’s net liquidity position falls into the negative.
On a quarterly basis, deposit inflows are typically largest in the first quarter. This gives credit unions a positive net liquidity position. Quarters two through four, however, have smaller deposit balance growth, which pushes net liquidity negative. In the past few years, the deposit flow in quarters two through four has resulted in smaller quarterly inflows and a continued decline of net liquidity. From midyear 2017 to midyear 2018, the credit union industry loaned $26.5 billion more than it took in via deposit channels.
NET LIQUIDITY CHANGE
FOR U.S. CREDIT UNIONS | DATA AS OF 06.30.18

Despite strong share growth in the first quarter, the growth differential between loans and deposits widened in the second quarter and pushed the change in net liquidity further negative.
Source: Callahan & Associates.
Over the past five years, the average credit union loan-to- share ratio has increased 15.5 percentage points. In the second quarter of 2018 alone, it increased 3.3 percentage points to 82.9%. This is only 84 basis points below the 83.7% record high reached in the third quarter of 2008.
Selling first mortgage loans to the secondary market and repricing deposit products are two strategies credit unions can employ to manage liquidity. Another option is to sell loan participations to other financial institutions. As this removes the majority of the loans from the institution’s balance sheet, the end result is similar to selling first mortgages to the secondary market. Credit unions can convert assets into liabilities and free up capital by selling real estate, member business, and consumer loans. As such, year-to-date participation sales grew 7.8% year-over-year to $5.1 billion as of June 30, 2018.
Growing competition for interest and dividends on share accounts has led more credit unions to look to borrowings to fund loan growth. Total borrowings have increased from $26.7 billion in the second quarter of 2013 to $53.9 billion as of June 30, 2018. A full 93.2%, or $50.3 billion, of borrowings are from the Federal Home Loan Bank. Draws against lines of credit have accounted for 58.4% of total borrowings and have represented more than half of the borrowings portfolio for the past four years. Other notes, repurchase transactions, subordinated debt, and secondary capital comprise the remainder.
Income Statement
-
Interest income posted strong results through the second quarter of the year.
-
Non-interest income accounted for 27.1% of total revenue as of June 30, 2018.
-
Loan and investment income gains outpaced rising deposit and borrowing expenses.
Year-to-date revenue increased 13.1% from year-to- date 2017 levels for credit unions nationwide. This marked the second consecutive quarter of double-digit annual growth.
Rising interest rates and sustained loan demand underpinned strong performance in interest income, the primary driver of revenue growth, through the second quarter of the year. Nationally, total interest income at credit unions increased 13.3% year-over-year. Loan income increased 12.3% while investment income increased 21.4%.
Average loan yields increased for the fifth consecutive quarter. Rising interest rates have gradually impacted credit union earnings, and the average yield on loans for the industry stood at 4.60% as of June 30, 2018. That’s up 10 basis points from one year ago.
TOTAL REVENUE AND ANNUAL GROWTH
FOR U.S. CREDIT UNIONS | DATA AS OF 06.30.18

The NCUSIF rebate underpinned a 19.3% increase in other operating income. Total revenue was up 13.1% at midyear 2018.
Source: Callahan & Associates.
The yield curve has flattened over the past year. Much of the movement has occurred on the front end of the curve, which has pushed short-term rates higher. Nearly half 47.8% of the credit union investment portfolio is allocated to products with maturities of less than one year. As such, the industry is well positioned to benefit from rate increases in the form of rising investment income.
Non-interest income expanded 12.5% annually and accounted for 27.1% of total revenue as of June 30, 2018. The two primary components of non-interest income fee income and other operating income rose 5.4% and 19.3%, respectively, year-over-year. Fee income includes punitive as well as non-punitive charges, such as non-sufficient funds charges and application fees, respectively. Other operating income includes interchange income, CUSO income, gains from secondary market sales, and more. The much faster growth in this component which was up 6.1% from last year is largely attributable to the recognition of NCUSIF rebates that began in the first quarter of 2018.
As rates have increased, so, too, has the cost of funds. Collectively, dividends and interest on shares grew 21.8% from the second quarter of 2017 to $3.7 billion as of June 30, 2018. Interest on borrowed money grew at a faster clip it was up 33.5% from 2017’s year-to-date levels. As a percentage of average shares and borrowings, the cost of funds was up 10 basis points from June 30, 2017. This marked the fifth consecutive quarterly increase in the industry’s average cost of funds and was the highest it’s been since Dec. 31, 2012, when it was 0.82%.
For the moment, loan and investment income gains are outpacing rising deposit and borrowing expenses. As such, taking into account both interest income and interest expense, the net interest margin for the industry rose 14 basis points to 3.07%. This is only slightly lower than the recent high of 3.12% recorded in the fourth quarter of 2011. In comparing the net interest margin to the operating expense ratio a baseline to determine the extent to which credit unions rely on non-interest income to cover non-interest expenses a favorable trend emerges. Although the net interest margin remained below the operating expense ratio at midyear, the gap between the two tightened to 0.03%. This is the smallest difference since June 30, 2011, when the average net interest margin and operating expense ratio were 3.16% and 3.15%, respectively.
Benefiting from favorable interest income gains and NCUSIF rebates, net income for the industry grew 24.5% to $6.4 billion. When accounting for relatively slower asset growth, the average return on assets at credit unions improved 13 basis points to 0.90%, which is in line with the rate reported in March.
Member Engagement
-
The credit union movement added 4.7 million new members year-over-year.
-
Credit card penetration held steady, but auto loan and share draft penetration both increased.
-
Credit unions captured more market share in important service areas.
More than 4.7 million members joined the credit union movement in the past year, pushing credit union membership in the United States to top 115 million as of June 30, 2018.
On a per member basis, the average credit union member excluding businesses held $10,499 in deposits and $8,238 in loans as of the second quarter of 2018. The average member relationship increased 3.2 percentage points year-over-year to $18,737. Over the past five years, this measure of retail member relationship has increased $3,151, or 20.2%.
What Is The Average Member Relationship?
Loans + Shar