Credit unions entered 2026 navigating a complicated environment: shaken consumer confidence in the economy, shifting interest rates and subsequently changing membership needs, and a profitability picture that is simultaneously encouraging and fragile. Credit union performance data points to several themes worth watching as credit unions move into the second quarter.
No. 1: Consumers Need Support Now More Than Ever
INDEX OF CONSUMER SENTIMENT
FOR 900-1,000 MONTHLY WEB INTERVIEWS | DATA AS OF MARCH 2026
SOURCE: UNIVERSITY OF MICHIGAN SURVEYS OF CONSUMERS
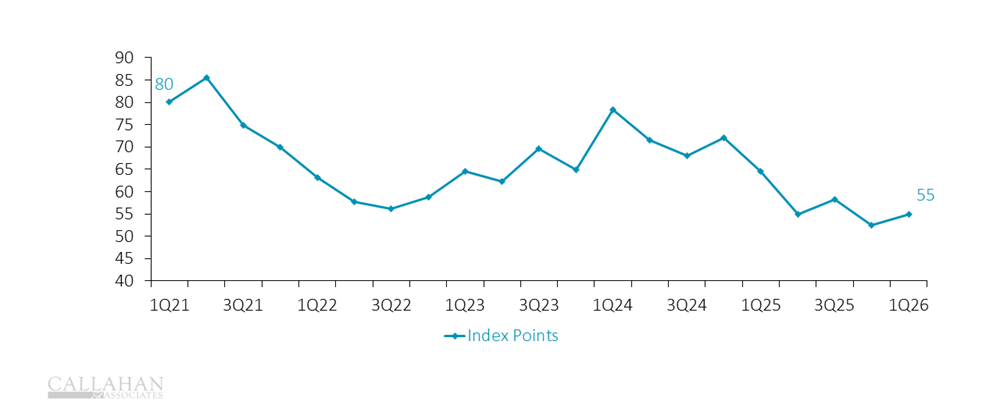
- After a brief rebound in early 2024, the Index of Consumer Sentiment declined steadily throughout 2025 and into 2026. The reading of 55 in March 2026 was even lower than the peak days of the COVID pandemic and signals genuine household anxiety rather than routine fluctuation. When consumer outlook is this uncertain, households often pull back on borrowing, delay major purchases, and prioritize liquidity.
- Of course, social media and the 24-hour news cycle can skew the perception of economic health away from household reality. Indeed, certain segments of the economy are doing OK; unfortunately, others are hurting. With this context, it’s important to remember that macroeconomic data represents the average and credit unions serve those on the lower end of that economic spectrum.
- For credit unions, today’s reality is both a warning and an opportunity. Members under financial stress are more likely to need guidance, restructuring options, and financial counseling. Institutions that show up proactively — rather than waiting for delinquencies to surface — will deepen loyalty when it matters most.
 Watch Trendwatch on demand today. Did you miss this quarter’s live Trendwatch webinar? No worries! Catch it on demand. Learn about first quarter performance trends from industry experts and take note of the practical insights you can act upon today to strengthen strategy, serve members better, and perpare for what comes next. Watch Trendwatch today.
No. 2: Member Growth Is Historically Low; Confounding Factors Are At Play
ANNUAL MEMBER GROWTH
FOR U.S. CREDIT UNIONS
SOURCE: CALLAHAN & ASSOCIATES
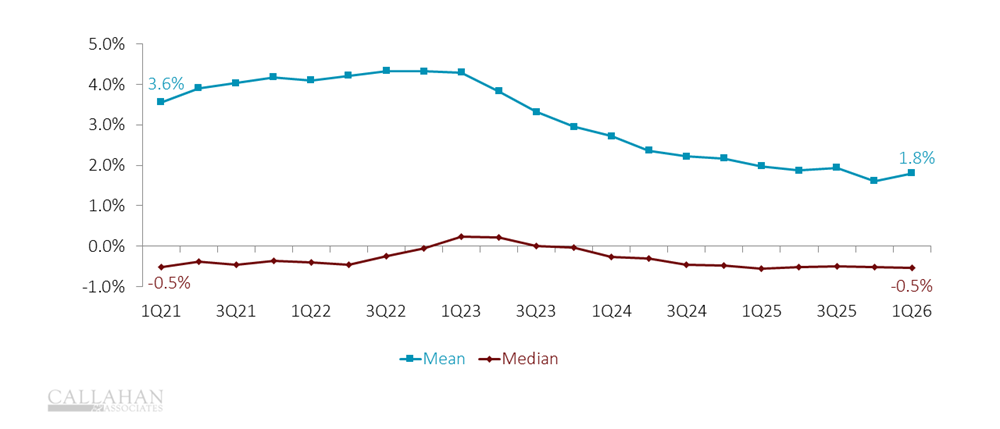
- Membership growth remains sluggish despite a slight uptick in the first quarter. Much of the prior-year volume came from indirect lending — a channel that’s often expensive and ill-suited to building lasting relationships. Credit unions have pulled back from indirect lending and now must find new ways to tell their story and fill their lending pipelines.
- Membership growth is diverging by asset size — smaller credit unions are posting rates as low as -0.5%, whereas larger peers hold near 1.8%. Scale plays a role, but so does an education gap: younger members increasingly don’t know what they’re missing. Smaller credit unions have the opportunity to make the case for community finance to a generation that hasn’t heard it yet.
- On the bright side, relationships with existing members are deepening. Products per member and average relationship balances are up, as are most product penetration rates. In short, fewer new members might be joining the movement, but credit unions are still heavily supporting their core member base.
No. 3: First Mortgages Are Carrying Loan Growth
YEAR-TO-DATE LOAN ORIGINATIONS
FOR U.S. CREDIT UNIONS
SOURCE: CALLAHAN & ASSOCIATES
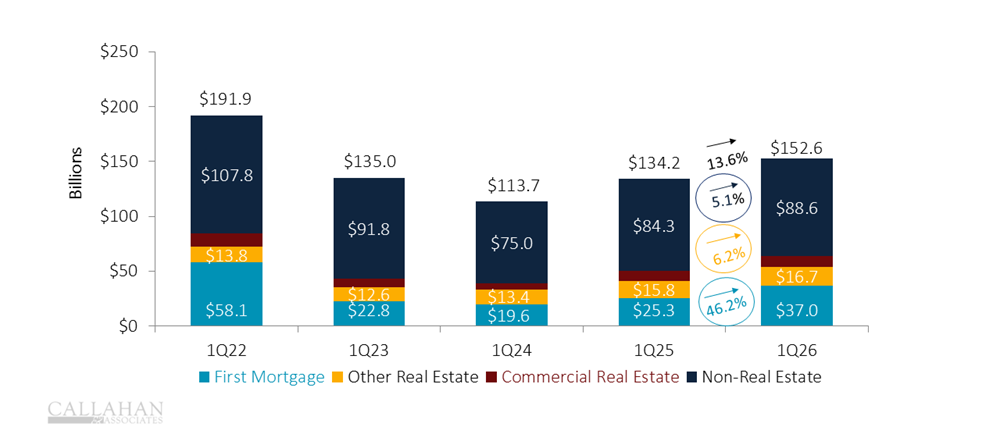
- Year-to-date loan originations hit $152.6 billion as of the first quarter of 2026; that’s a 13.6% increase from this time last year. First mortgages have been doing the heavy lifting. As rate cuts filter through the housing market — and prices stabilize in many markets as wages partially catch up — demand for homebuying and refinancing is returning. Credit unions with a strong mortgage infrastructure are well-positioned to capitalize on this trend, especially in the relationship-driven refinance space where credit unions historically thrive.
- Other real estate and commercial real estate categories contributed to loan growth to a lesser degree. Auto lending, which dominated origination activity in prior years, is notably absent as a growth driver — a reflection of the industry’s retreat from indirect lending, tariffs, elevated vehicle prices, tighter consumer budgets, and the continued hangover from pandemic-era buying behavior.
No. 4: Asset Quality Is Improving … Seasonally, At Least
ASSET QUALITY RATIO
FOR U.S. CREDIT UNIONS
SOURCE: CALLAHAN & ASSOCIATES
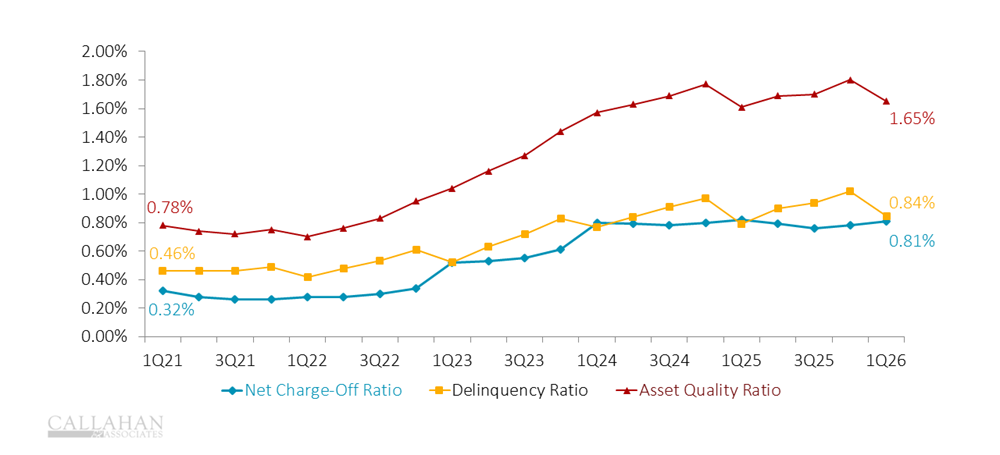
- Credit unions reported the typical first quarter improvement in the asset quality ratio. Net charge-offs and delinquencies ticked down from elevated year-end levels. Delinquency ratios came in at 0.81%, whereas net charge-offs settled at 0.84%, for a combined ratio of 1.65%. These numbers are better than the fourth quarter of 2025 but remain higher than pre-pandemic norms.
- First quarter seasonality is relevant. Tax refunds, holiday debt payoffs, and January financial resets temporarily reduce delinquency. The real test will come in the second and third quarters when the buffer fades and credit unions will see if consumer sentiment reflects repayment reality. The good news? The industry remains well-covered for delinquency and has a strong net worth on average. The cushion is there to help struggling members at a time when banks or other financial institutions might turn them away.
No. 5: Now Is The Time To Build Capital And Invest Strategically
OPERATING EXPENSE RATIO VS. NET INTEREST MARGIN, ANNUALIZED
FOR U.S. CREDIT UNIONS
SOURCE: CALLAHAN & ASSOCIATES
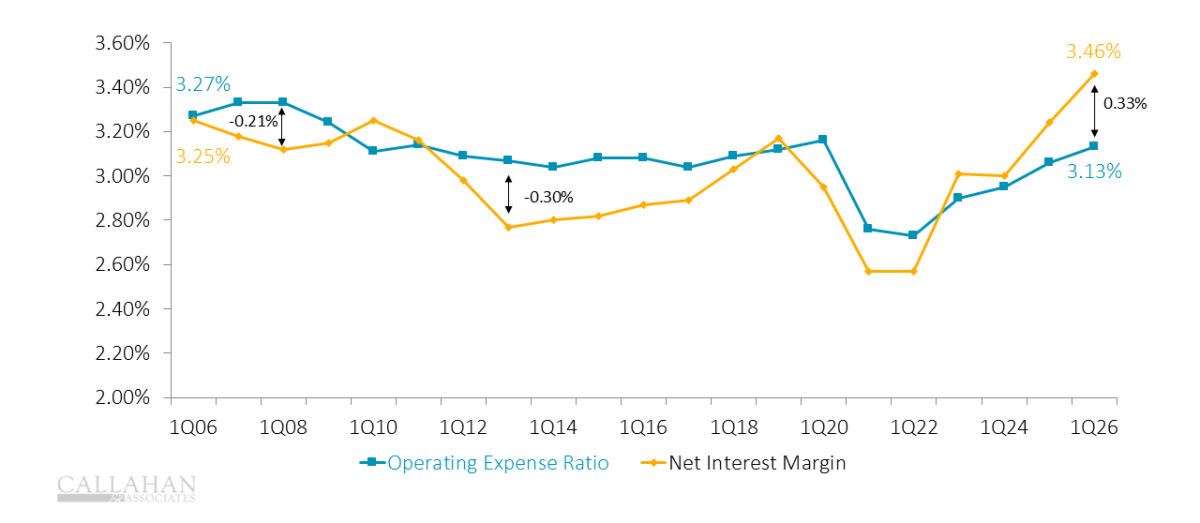
- The gap between the net interest margin and the operating expense ratio is the widest it’s been in decades — a 0.33 percentage point spread that reflects the unusual and favorable environment credit unions have been operating in since rates began rising in 2022. For now, this margin cushion is providing real earnings flexibility.
- Even with slowing non-interest income revenue, and increasing provision expense, credit union ROA is up to 0.85% annualized. This is a relatively high return on assets, giving the industry some freedom to build allowance and net worth cushions.
- However, pressures are building from both directions. If rates ease, asset yields historically compress. Meanwhile, operating expenses rarely come down for long — technology investments, staff costs, and compliance burdens continue to climb with inflation. Credit unions that treat today’s margin environment as permanent could be caught off guard. In the meantime, the window to build capital, invest strategically, and reduce structural cost is still open. Effective investment in operational efficiency is a key way to manage expanding operating costs.
See the patterns behind this quarter’s trends. Trendwatch highlights key themes drawn from industrywide data. Peer Suite’s Premium level helps leaders evaluate their credit union’s performance across the same core metrics, using handpicked peer groups and deeper context to support understanding and discussion. Start your free 30-day trial.
![]() See You Next Quarter! CreditUnions.com updates this page with the freshest FirstLook credit union data every quarter, so don’t forget to come back for insights into the second quarter of 2026.
See You Next Quarter! CreditUnions.com updates this page with the freshest FirstLook credit union data every quarter, so don’t forget to come back for insights into the second quarter of 2026.