CU QUICK FACTS
Interra Credit Union
Data as of 12.31.16
HQ: Goshen, IN
ASSETS: $918.9M
MEMBERS: 70,538
BRANCHES: 16
12-MO SHARE GROWTH: 14.5%
12-MO LOAN GROWTH: 21.6%
ROA: 0.52%
Two years ago, Interra Credit Union ($918.9M, Goshen, IN) took major steps to evolve its homegrown approach to and reporting of enterprise risk management. It created a new assistant vice president position to head its ERM efforts, enlisted an outside consultant to conduct a risk assessment, and overhauled its reporting strategy. Those moves have contributed to an organization with staff that speaks the same language, buy-in from the top down, and reporting that measures risks in all areas against the same standards.
In this QA, Angela Pletcher, Interra’s vice president of enterprise risk management, discusses the credit union’s ERM strategy.
How does Interra approach ERM?
Angela Pletcher: Approximately two years ago, Interra created a new assistant vice president position for enterprise risk management. The credit union had been doing risk management for years, but we wanted to launch a more formal ERM program to assess, measure, and manage risk across the organization.

Angela Pletcher, Vice President of Enterprise Risk Management, Interra Credit Union
After exploring different software options and visiting other credit unions, we decided to use a consultant, Quadrant Risk Advisory, to help us with our initial business line risk assessment process and training.
It’s important for everyone, especially the department heads, to understand what ERM is and use common terminology. We use a consistent method to score risk across the organization, and we use Excel-based documents for our reporting.
Why didn’t the credit union implement a software solution?
AP: We felt a software solution would box in the credit union. Instead of developing the ERM program around what a certain software can do, we wanted to build a program that would work for us.
We might implement a software solution down the road, but at that point we’ll have the experience of knowing what we need it to do and be able to better evaluate our options to see what fits the model we’ve established.
ContentMiddleAd
Please describe Interra’s ERM dashboard.
AP: We built six different dashboards based on the results of the consultant’s ERM risk assessment of the credit union. We enhanced these last year to improve decision-making. Each dashboard is a separate worksheet within a larger Excel document.
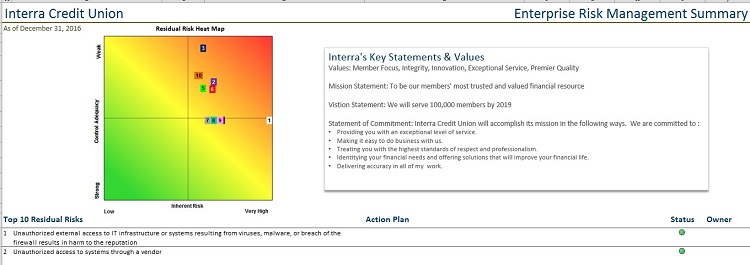
We start with a summary, which displays a residual risk heat map that ties in with our top 10 ERM risks along with any high-risk audit or regulatory findings. The summary also identifies risks as well as an action plan and the status of each risk.
We haven’t seen a lot of change in our top 10 ERM risks. Many enterprise risks, such as unauthorized access to IT systems, tend to stay on our summary page. However, we continually update our action plans.
See Interra’s ERM dashboard at work. Click through the tabs below to see screenshots.
1. Risk Management Summary

Interra’s ERM dashboard includes a summary display with a residual risk heat map that ties in with the credit union’s top 10 ERM risks along with any high-risk audit or regulatory findings.
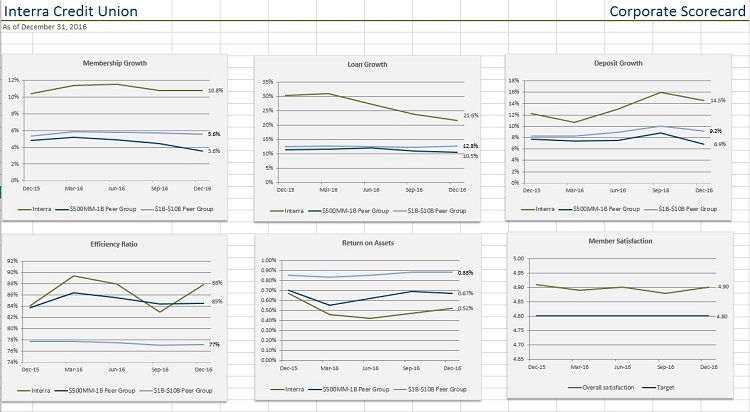
2. Corporate Scorecard

The ERM dashboard also includes a corporate scorecard that provides a graphical display of performance in key metrics.
3. Asset/Liability Risk Summary

Each tab in the dashboard includes different graphs and a summary box that bullets out the key risks or measurements in that area, notes anything that is outside of policy, and points out any significant emerging risks.
We also include a corporate scorecard as part of our ERM dashboard. This includes key metrics like membership growth, loan growth, and deposit growth with graphs of each.
We then go through credit risks, ALCO risks, and operational and compliance risks.
Each dashboard includes four different graphs and a summary box that bullets out the key risks or measurements in that area, notes anything that is outside of policy, and points out any significant emerging risks.
Because Quadrant Risk Advistory worked with us to create these, we’re able to maintain and enhance them. For example, if we want to change our measurements or indicators, we can easily modify the dashboard.
How often do you update and share the reports?
AP:We update the ERM risk assessment by business line on an ongoing basis throughout the year. We meet with each department head to review specific risks and discuss changes in process, controls, procedure, etc. We do the same for new services as they are developed.
We update the actual reporting and dashboard quarterly and present that to our ERM committee and board of directors. The ERM committee consists of myself, as chair, our CFO, COO, chief strategy officer, CEO, vice president of IT, and participants from internal audit, fraud, compliance, retail, and consumer lending services.
Instead of developing the ERM program around what a certain software can do, we wanted to build a program that would work for us.
It is a good range of individuals who attend, but only a select few are voting members. We meet monthly to discuss various risks, but update the dashboards only quarterly because those are meant to help us look at longer-term trends and prepare for the future.
Other committees, such as the Loan Committee, are looking at specific risks such as the delinquency rate in more depth every month and acting on a day-to-day basis, if needed.
Has the overall impression of ERM throughout Interra changed?
AP: Yes, and having buy-in from the top-down has been a key driver of that.
In the beginning, not everyone fully understood or saw the value of ERM. That was a challenge initially and took some tough conversations, but now we have a better process in place with clear direction.
One area that is still a challenge to convey is that we must remain forward-looking in our ERM efforts. It is easy to get caught up in looking at the data and trends of the past rather than focusing on what it says about where we are going in the future. That’s why we talk about emerging risks and make sure those are part of our ongoing discussions.
Working with each of the department heads has been critical. We hold individual sessions with them to discuss their specific area, but we also broke our initial training on ERM into different sessions so we could tailor it to various groups, such as the board, executive team, and department leaders.
Now that we’re several years into our program, we want to continue promoting that risk culture throughout the organization. Everyday decisions can impact the larger organization, and we want all our staff to think more cross-functionally across the credit union. This is built into our 2017 strategy.
What advice would you give on how to make ERM more approachable?
AP: Define ERM early on and adopt consistent terminology.
We use the same rating scale and measure risks in all areas against the same standards. This makes it easy for everyone to understand when something is a material risk.
It’s also important to be open to hearing from department heads and staff members. People are often fearful of bringing up something they know is wrong or that might pose a risk because they don’t want to get in trouble or have something look bad on them or their area. Let people know it’s OK to have those discussions and bring forth these items. We found meeting with the department heads separately without executives in the room helped remove that barrier.
Lastly, don’t jump into a software relationship too early. Really explore all your options.
This was critical for us and has given us the flexibility to make changes in a cost-effective way as we evolve our program.
The perpetrators of payments fraud never take a day off. They are reliably relentless in their criminal mission to separate people and companies from their valuables. Fraudsters start with deception and data theft to acquire the keys that ultimately unlock a treasure chest of assets that they then peddle on the dark market. And when these digital pirates who troll the cyber seas are thwarted in one of their attacks, they simply adapt and move on to another, perhaps more vulnerable target.
The fraud network is an elaborate and illicit underworld exchange. The precious commodity of confidential information ― Social Security numbers, account numbers, passwords and more ― is auctioned, bought, and sold for profit at the expense of the owners (and protectors) of the data.
The devious techniques used by fraudsters continue to evolve. The methods and tools we use to detect and prevent fraud today may no longer be as effective or comprehensive as the ones we need tomorrow. Instead of waiting for the next attack, proactively addressing emerging fraud threats can dramatically reduce the number of fraudulent transactions and mitigate fraud losses.
Credit unions should adapt their risk management strategies to account for these two relatively new types of fraud:
Loyalty Redemption Fraud
A fast-growing trend globally, loyalty fraud is a way for fraudsters to launder money by stealing and then reselling rewards points or goods. It targets the loyalty rewards points members accumulate from their debit and credit card transactions. Loyalty fraud costs more than redemption points, and it carries a potential negative impact to the credit union’s reputation and brand.
PSCU recently announced deployment of new technology to minimize loyalty rewards redemption fraud for all CURewards credit unions. The platform uses an advanced authentication process to validate all entities in the points redemption loop ― the device, the member, and the redemption transaction.
The tool detects suspicious activity through digital risk-engine rules that block and eliminate: blacklisted devices, inconsistent location indicators, suspect form-filling behaviors, and multiple redemptions under different identities from a single device.The tool was instrumental in blocking 11 attempts of fraudulent redemptions worth 1.2 million points during its pilot phase of implementation.
Caller Authentication Fraud
Call center fraud happens when criminals use the phone channel to impersonate consumers to gain access to their account funds and sensitive data. More than 61% of fraud starts with a phone call, and the voice channel accounted for more than $10 billion in fraud in the U.S. in 2016.
Pindrop is a fintech pioneer in voice security and caller authentication. The company’s patented Phoneprinting technology analyzes calls to identify malicious behavior and verify legitimate members. It analyzes nearly 150 characteristics of a call to create a unique audio fingerprint that reveals the type of phone the caller is using, the geographic location of the call’s origin, and whether the caller has been seen before.
Pindrop’s technology stops 80% of all phone fraud with less than a 1% false positive rate. PSCU recently became the first credit union service provider to contract with Pindrop to use its proprietary platform to fight call center authentication fraud.
It is imperative that credit unions and their partners protect every transaction across multiple payment channels and points of interaction. Continued investment in the strongest risk management tools and practices available is essential in protecting members from the potential financial and reputational damage associated with fraud.
Identifying fraud attempts early on can reduce costs associated with the fraud lifecycle, which makes early detection more important than ever.
In 2016, PSCU analyzed and scored 2.1 billion individual transactions for the presence of fraud and investigated 1.7 million transactions based on alerts generated by its fraud detection platform. The company reported savings for its Owners of more than $300 million in losses in 2015 and 2016 by nullifying fraudulent transactions directly at the point of attempt, as well as industry-leading fraud-to-sales ratios and above industry average fraud recovery rates for credit and debit cards. PSCU processed 365,000 fraud cases in loss recovery efforts in 2016 for its Owner credit unions.
Credit unions can leverage the scale and buying power of their partners to shore up their own risk management strategy and protocol. Working with these partners to identify and address emerging fraud trends like loyalty redemption fraud and caller authentication fraud can go a long way toward not only preventing fraud, but also to creating a more seamless and fulfilling member service experience.
Jack Lynch serves as Senior Vice President, Chief Risk Officer leading PSCU’s Fraud and Risk Management Operations Area. Jack has over 25 years of leadership experience delivering operational services, project management, client implementations, process re-engineering, account management, training, and technology services.
The self-employed, 14.6 million in all, represented 10% of the nation’s 146 million workers, and in turn provided jobs for 29.4 million other workers, according to a 2014 Pew Research Center analysis of data from the U.S. Census Bureau.
Analyzing the self-employed borrower (SEB) may require a little more effort and attention compared to your typical borrower, but when they represent 10% of your potential business you can’t afford to ignore them.
With the right tools and training, you can determine a self-employed borrower’s ability to repay a loan with nearly as much speed and accuracy as a typical borrower. From brewmasters and chocolatiers to dog walkers and toy makers, you won’t bat an eye when you learn they’re self-employed ― it’s simply another customer you’re eager to help with their mortgage.
The ABCs Of SEB
What makes someone a self-employed worker? Self-employed people work for profit or fees in their own business. They could be sole proprietors of their business or own it in partnership with others. Also, the businesses run by self-employed workers may assume any of several legal forms, including incorporation.
Why is it so complicated to determine whether they can and will repay a mortgage loan? Because obtaining an estimate of their earnings from tax returns can be much more confusing than a typical borrower. With a typical borrower, you can get a good snapshot of their income from a W-2 Form, a pay stub or Verification of Employment documents. However, with a self-employed borrower, there is no independent third party to verify employment and income. Without the employer providing the W-2 or Verification of Employment documents, the most credible sources to verify income are the tax returns that have been submitted to the IRS.
The primary challenge is that for self-employed borrowers, their accountants are experts at reducing tax liabilities by minimizing current net income. So, although the tax return reveals the borrower’s taxable income, it really doesn’t reveal their actual cash flow. And that’s what you need to find out ― because cash flow is what’s used to pay back the loan.
Tools Training For Evaluating The Self-Employed Borrower
It’s almost impossible to determine the cash flow of a self-employed borrower without the right tools. That’s where we come in. MGIC offers two ways to help lenders and underwriters determine the cash flow of a self-employed borrower:
Click here to access online, editable cash flow worksheets in PDF form.
- Line-by-line instructions guide you through the process and built-in calculators perform math functions
- Each line item contains a link to more detail in the Self-Employed Borrower Resource Guide
- Saves to your computer so you can come back to complete or edit at your convenience. Training through online, interactive webinars
- Dedicated trainers respond to your questions in real time
- Printable worksheets help you learn as you go
- Multiple sessions a month to fit your schedule
- Webinars are recorded to reference at your convenience
MGIC, the principal subsidiary of MGIC Investment Corporation, serves lenders throughout the United States, Puerto Rico, and other locations helping families achieve homeowner-ship sooner by making affordable low-down-payment mortgages a reality. At Feb. 28, 2017 MGIC had $182.9 billion of primary insurance in force covering approximately 1 million mortgages.