Top-Level Takeaways
-
Team members in specialized departments are helping employees across Lake Trust Credit Union collect, analyze, and act upon data.
-
Collections, branches, and human resources have all benefitted from the credit union’s data analytics efforts.
The ability of staff members at Lake Trust Credit Union ($1.9B, Brighton, MI) to interpret and leverage data has spread across the enterprise in the two years since the Michigan cooperative deployed a business intelligence team.
Today, the credit union’s BI team helps Lake Trust managers integrate separate data sets into dashboards that deliver deep levels of insight into the operation’s performance.
The credit union began this journey in its collections department, where the BI team used Microsoft’s PowerBI tool to build a reporting mechanism that draws data including application information, credit score trends, balances and last transactions, payment and employment history, and more from the core and third-party systems and gives collectors the information they need to make a successful call.

Lake Trust followed up that early success by using the visualization software to create membership reports that solidified the definition of a member, says executive vice president Kara Stuewe. Those reports include information about account openings and closings, channels used, and ATM and PTM dashboards.
Today, Lake Trust is using its newfound data power to underpin what it calls a balanced dashboard that any teammate in the organization has the ability to access. Managers can check progress toward organizational goals, and many business units and departments have used the dashboard to develop their own scorecards, Stuewe says.
See how the branch strategy team at Lake Trust Credit Union combines several data types into reports that help the team evaluate markets and branches.
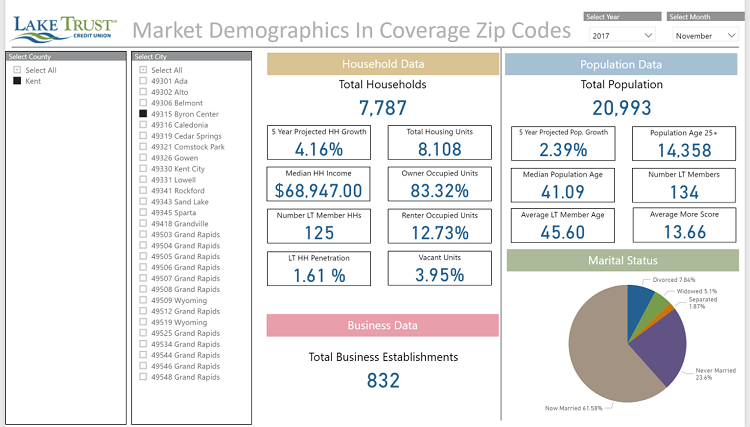
MARKET DEMOGRAPHICS IN COVERAGE ZIP CODES

Market demographics examined through coverage ZIP codes include population, household and business data, growth projections, and other factors.
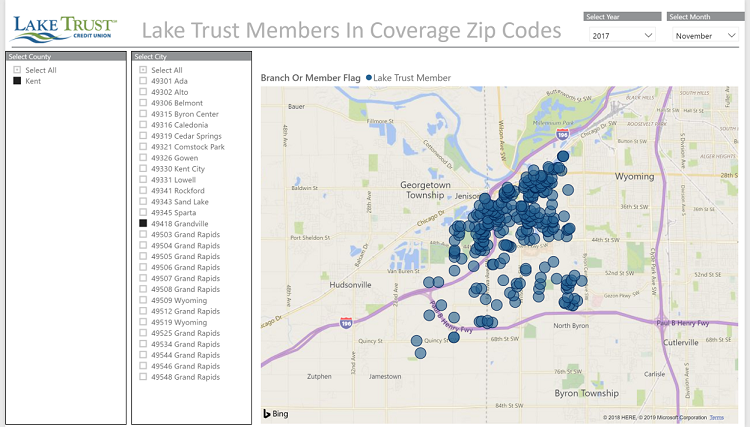
LAKE TRUST MEMBERS IN COVERAGE ZIP CODES

Lake Trust strategists use this view to map where members live and shop within a market.
TOP REASONS FOR CLOSURE TRENDS

This view provides a granular, comparative look at why members close accounts.
NEW/REOPEN MEMBER CHANNEL TRENDS

Lake Trust decision-makers track how and where members open accounts with this visualization.
LAKE TRUST ATM LOCATIONS

Color coding helps Lake Trust strategists connect the dots in their ATM strategy.
COMMERCIAL RELATIONSHIPS

Lake Trust strategists have reporting power and versatility at their fingertips. This dashboard combines multiple data sets including commercial relationships, goals, and locations into a single view.
Bridging The Data Gap
Lake Trust’s analytics and visualization work began with acknowledging the challenge of integrating data and desires.
“We have more data than we can ever use,” Stuewe says, “primarily because of the disparate array of data stores. The gap was access to it.”
Like most credit unions, Lake Trust has plenty of data sources, including core systems, transaction systems like ATM and card networks, the call center, investment and insurance services, credit reports, and mortgages. Participating in several CUSOs added an additional wrinkle, and the lack of skillsets and tools to pull the data and then make sense of it didn’t help, either.
But the credit union faced the challenge head-on.
“We spent time training teammates, gaining new tools, and allowing time to learn these tools,” says Stuewe, whose purview as EVP includes finance, decision support, and corporate services. “We still have challenges today at times, but now we have the resources available to help navigate the data.”
A Two-Pronged Team Approach

Lake Trust reviewed several visualization tools for functionality, alignment, financial impact, and more before landing on PowerBI. Jack Martin, the credit union’s senior vice president of information technology, says PowerBI is easy to use and integrates with other Microsoft tools. It also offers the ability to publish dashboards to an online portal, has good security, and requires minimal infrastructure investment.
All of this aligns with the credit union’s goal of democratizing data.
Every employee can access organization scorecard performance and progress and in some cases track their team progress toward goals, Martin says.
Along with deploying a data visualization tool, Lake Trust has given two teams Business Intelligence and Analytics, and Decision Support the power to address the analytics opportunity across the enterprise. The experts on these teams provide direct assistance as well as help subject matter experts across the organization pull their own data and create their own visualizations.

The Business Intelligence and Analytics team comprise a small group of data engineers and a data scientist. They focus on organizing the data for consumption by the Decision Support team and the broader business teams, says business intelligence manager Adam Blacke.
“The team also conducts training and education programs to cascade insight and analytics skills throughout the organization,” Blacke says.
Meanwhile, the Decision Support team includes a small group of analysts that serve as business experts and work alongside the BI team and others in the organization. The team manages a help desk that provides data, information, and analysis to anyone in any department looking to make a decision or just inform their thinking, Blacke says.
Although the two teams work together on particularly complex data requests and issues, a lot of the work by the Decision Support team focuses on specific work, business processes, and insights, specifically how to do those more efficiently and save time on recurring needs, Blacke says.
Other Signs Of Success
Along with collections, the Decision Support team has worked with other business units to help staffers pull, display, report, and gain actionable insights from the data now available to them.
These first reach outs were with others in the organization that have a desire to learn and use the information and have the resources the time to engage in this work, says EVP Stuewe.
For example, the data experts helped their colleagues analyze employee statistics, including hiring and performance trends, to help predict future turnover levels and gain insights into successful hiring that leads to high-performing employees.
The team also helped Lake Trust dig deeper into what makes a high-performing branch staff.
They looked at achievement of goals, branch turnover, and length of employment from a team perspective, Stuewe says. Operation analytics included peer rankings, balances, member branch visits, transactions, and financial performance such as branch profitability, new account revenue, operating expense, revenue, and other ratios by members.
New In 19
Lake Trusts efforts surrounding data analysis and visualization are playing an important role in supporting the credit union’s 2019 business plan and strategy implementation, Stuewe says, pointing to deposit retention and growth as one area of focus.
The credit union also has plans to expand its overall data capabilities. Training to empower more self-service data pulls and analyzation are on the horizon. So is implementing a data warehouse, stepping into predictive modeling with an eye toward enhancing the member experience, and even deploying a chat bot.
That’s a lot. But Stuewe is confident.
“We have a self-empowered team that is positioned to deliver on established priorities,” the Lake Trust EVP says. “They’re already strong, and they’re developing additional skill sets.”
Power Tips For PowerBI
Kara Stuewe and Jack Martin of Lake Trust Credit union share four best practices they’ve gleaned during their two-year journey into data analytics and visualization.
- Recruit experienced talent from outside the financial services industry.
- Define clear objectives and focus on developing insights that provide the most value and/or align strategically.
- Break projects into small pieces and deliver incremental value.
- Don’t sacrifice data quality along the way.