The past couple of years have been tumultuous for the U.S. — and world — economy. COVID shutdowns, supply chain constraints, and inflation have made for unprecedented market conditions. COVID and supply chain issues suppressed lending in 2021; then, consumer lending rebounded in 2022, taking the baton from a slowing mortgage market.
Credit unions have met member demand with loans and deposit accounts. The movement even added more than 5 million new members in 2022. As market conditions have changed, however, so has consumer behavior.
Members deposited funds at a record rate throughout the pandemic; that inflow reversed course in 2022. When members had abundant liquidity and the cost of borrowing was low, credit unions enjoyed unprecedented asset quality. Now, members’ savings are drying up and rates are rising, forcing members to make difficult budgetary decisions.
Closely monitoring delinquency and charge-offs is key in helping credit union leaders understand how their asset quality is changing.
Delinquency
Inflation has been a challenge throughout the past couple of years, and members have adjusted their spending habits to keep up with rising costs. The nation’s personal savings rate closed out 2022 at 4.4%, according to the St. Louis Fed. Not since the Great Recession have Americans had such a low savings buffer, and credit unions are feeling the pinch in their asset quality.
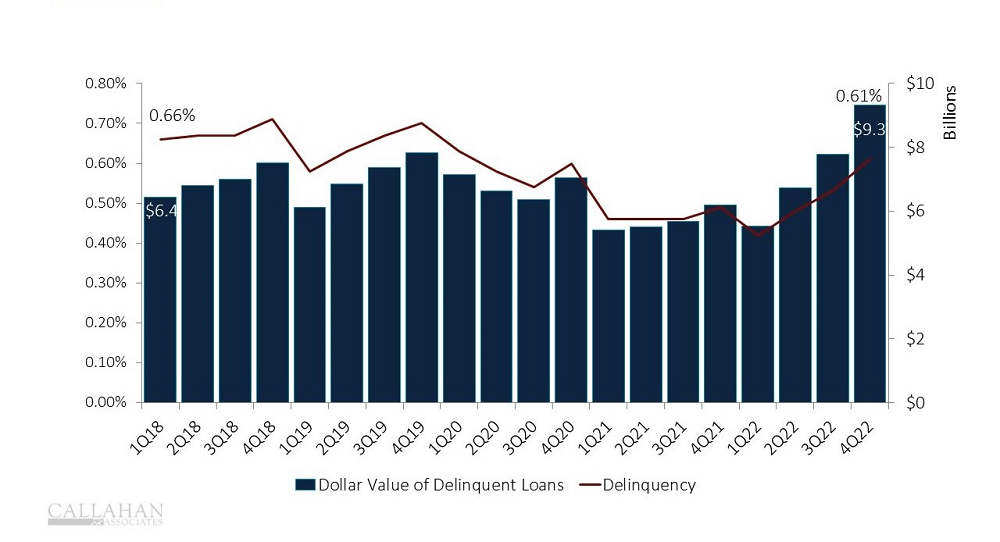
Total delinquencies reached $9.3 billion in 2022, the highest outstanding balance since 2011. Of course, total loans outstanding also have grown substantially during the past decade, and the overall delinquency rate remains at a healthy 0.61%. Still this is the first time since the Great Recession the dollar value of delinquencies has grown by more than 50% on an annual basis. Risk managers should closely monitor this metric, keeping in mind sudden increases in delinquency are typically a better indicator of trouble than a higher absolute value.
PERCENT OF DELINQUENT LOANS AND DOLLAR VALUE
FOR U.S. CREDIT UNIONS | DATA AS OF 03.31.23
© Callahan & Associates | CreditUnions.com

Perhaps unsurprisingly, auto loans comprise the highest portion of all delinquent loans in the industry. Supply chain constraints and a global microchip shortage have pushed up car prices the past two years. Many consumers are now stuck with high monthly payments along with overall higher costs of living. All told, the industry’s auto loan delinquency rate increased 25 basis points during 2022, closing the year at 0.67%. As auto loans make up nearly one-third of industry loan portfolios, a surge in late payments in this space can quickly strain earnings and capitalization.
Charge-Offs
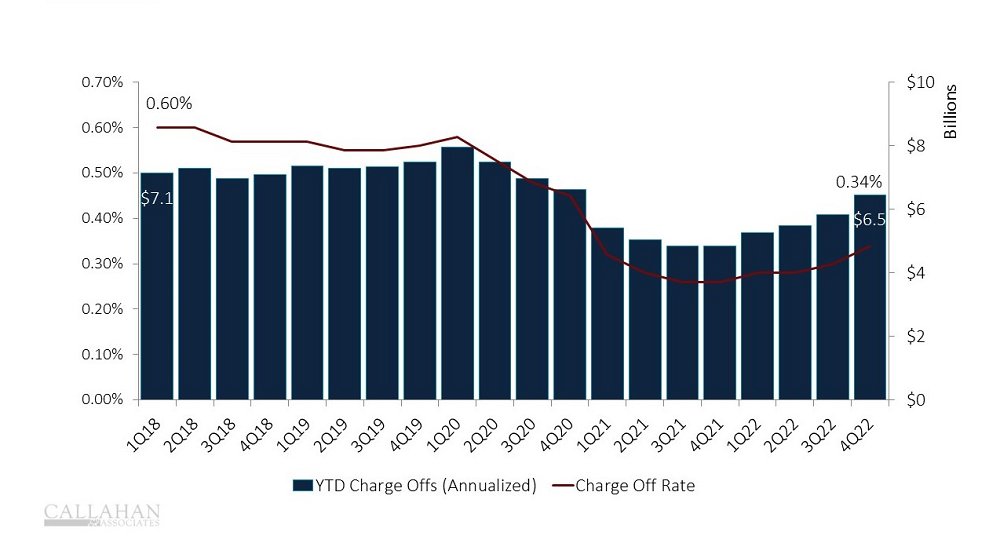
A charge-off indicates a loan is unlikely to be recovered, and the lender has reported the loan as a loss. Nationwide, the net charge-off ratio reached 0.34% at year-end, up 8 basis points from the year prior.
PERCENT OF CHARGE-OFF LOANS AND DOLLAR VALUE
FOR U.S. CREDIT UNIONS | DATA AS OF 03.31.23
© Callahan & Associates | CreditUnions.com

Although charge-offs remain near record lows, relatively speaking, the last time the growth rate was this high was in 2008 and 2009. It’s important for risk managers to note that higher delinquencies can be an early indicator that charge-offs will increase in the near future.
Of all major lending products, credit cards reported the most substantial increase in the net charge-off ratio — up 42 basis points annually to 2.29% — as members struggled with rising costs of living.
Looking Ahead
The credit union industry’s lending portfolio changed considerably throughout 2022. A rising interest rate environment and high home values priced out many prospective buyers. As a result, real estate concentration in the credit union loan portfolio decreased 17 basis points during the course of the year, closing 2022 at 43.9% of loans outstanding.
Consumer lending channels became more popular in the second half of the year, with products that are naturally riskier and less cleanly collateralized than real estate loans. Between riskier loan types and a generally more difficult economic environment for most Americans, loan quality has suffered.
At year-end, the industry’s asset quality ratio — the delinquency rate plus net charge-off ratio, a proxy for total troubled dollars — increased 20 basis points from 2021 to reach 0.95%.
Notably, first mortgage asset quality increased just 5 basis points from one year ago to reach 0.44%. On the other hand, credit cards and auto loans surged 94 and 31 basis points, respectively, to hit 3.77% and 0.95%. When forced to choose between loan payments, members will often prioritize higher-stakes loans like real estate over smaller loans like credit cards.
On top of everything, FASB’s current expected credit loss model, or CECL, went into effect on Jan. 1. As 2023 progresses, all the concerns listed above will also play out against potential shifts in net worth as credit unions shift more into their loss provisions. That question will be one of the key factors to watch as first quarter industry data is released.
How Does Your Asset Quality Compare?
Use industry data to determine how your credit union performs against others, uncover new areas of opportunity, and support your strategic initiatives. Callahan’s credit union advisors are ready to show you how — are you ready to see how you stack up?
Schedule Your Peer Demo

