Top-Level Takeaways
-
MSUFCU began its business intelligence unit in 2014, and now has four specialists with their own focus areas.
-
The team is providing targeted lists for outreach efforts such as e-statement adoption and credit card marketing campaigns.
-
Predictive analytics and advanced techniques for identifying potential market opportunities are in development.
Acting on member data is a growing imperative at Michigan State University FCU ($4.0B, East Lansing, MI), which is using an in-house business intelligence team to provide insight for every step of a member’s life cycle.
Membership is particularly fluid at the world’s largest university-sponsored credit union, which with an average age of 40 and median age of 38 skews young by credit union standards. Those numbers dip a bit each year in the third quarter as more than 3,000 student accounts join the roster.
Here, Sara Dolan, chief financial officer at MSUFCU, discusses the work of the BI team she leads.
Describe the history, organization, and role of MSUFCU’s BI department.

Sara Dolan: We created the business intelligence department in 2014 to centralize data research, analysis, and reporting. Prior to 2014, these tasks were completed in marketing, administration, and various departments.
Centralizing this function provides consistency in the source data and a broader perspective in each analysis. For example, if we’re evaluating trends in loan or membership applications, we can include information about promotions, rates, or regulatory changes that might have influenced results.
Centralization also improves efficiency by allowing the managers to spend time evaluating the results and using the data to make decisions and coach their teams rather than extracting data themselves to create the reports. The BI team is responsible for presenting and analyzing data; the database architecture is managed by IT.
Who does the team report to, and what do each of them do?
SD: We have four business intelligence positions and one intern. The team reports directly to the CFO. Each BI specialist has a specialty marketing, Visa, loans, or members but all are familiar with the systems and processes behind all of our reports. They create reports and analyze results to mitigate risks and identify opportunities.
What software does the BI team use?
SD: We use ARCU, which is Advanced Reporting for Credit Unions. It’s a Jack Henry BI and analytics product. It consolidates our core system data, and we have added data from external systems such as our mortgage servicing platform.
We import data from ARCU into Spotfire daily. We use Spotfire to create dashboards or visualizations of the data. The reports are dynamic, so we can drill down to the member level if necessary. I think it’s easier to interpret trends visually rather than in tables of numbers or data, so we try to create a visualization as part of our analysis. This usually results in an annotated chart.
What percentage of your membership start as college students? How many do you retain beyond that?
SD: In 2017, student accounts represented just over 12% of the accounts we opened. If a member joins through a student SEG, they remain coded as a student for the life of their membership. We separate current from former students based on age. Students/former students represent just over 26% of total members.
How do you address student engagement?
SD: We’re actively reviewing historic student engagement as well as changes for current students. This year, we covered student engagement as a topic at our annual management retreat and brainstormed ideas to attract and retain student members. This included a panel of students and Q&A session about how they interact with their financial institutions. Half of the panel were MSUFCU members and half were not.

Student members use more credit union services as they age and have a higher number of services per member than the average member at MSUFCU.
We measure retention based on account open date for the past 20 years. Since 1998, we’ve opened 157,000 student accounts and retained 65,000 (44%). Retention percentage of students still on campus opened between 2014-2018 is very high at 80%.
One of our challenges is retaining student members after they leave campus. Online and mobile banking has helped improve our student account retention it has also created a challenge in attracting new student accounts as most students have already established an account when they come to campus.
How does your BI team help form strategies and track success?
SD: We’ve incorporated BI into our project management process.
Reporting, monitoring, and measurements of success are included in the project vision statement, and a member of the BI team may attend project meetings to participate in discussions about how to best track the results.
Additionally, when a report or information is requested, the BI specialist will ask questions to determine what the data will be used to decide. This allows them to provide input into other data points that might be relevant to the analysis.
How does your BI team work with other departments?
SD: Our BI team is successful because of the collaboration with other areas. It’s critical that the business units have input on the structure, format, and information included in the reports.
When we create a dashboard, we start by sitting with the department management to identify the important information and the questions the data will answer. We then create, review, and revise draft reports until we agree on a final product.
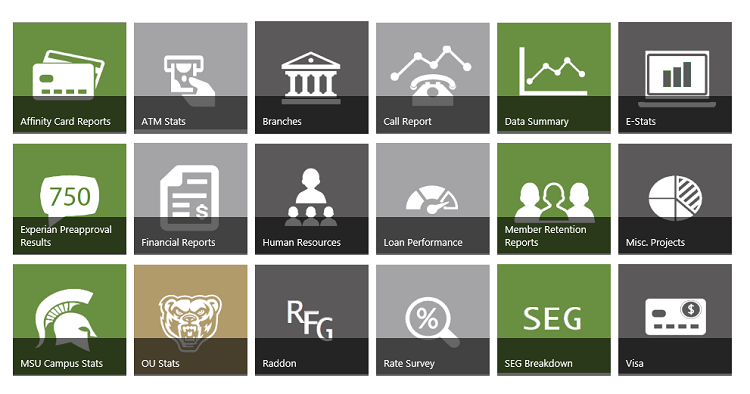
Once we finalize a report, we post it to our CU Stats page on the intranet and update it regularly (weekly, monthly, quarterly, etc.).
What are some examples of report requests that your BI team has received?
SD: We provided a list of 2,500 members that visit branch locations who received paper statements but had online access. The branches contaced these members to let them know how convenient e-statements are. In two weeks, the branches converted more than 1,500 accounts from paper to electronic statements.
BI worked very closely with card services and finance to analyze the target market for a new card product. We analyzed card transaction data, member demographics, and product penetration for current cardholders as well as opportunities to capture spend from other cards.
Fab 4 (Plus An Intern)
The BI team at MSUFCU has four specialists focused on specific areas, plus an intern. Here’s what each does.
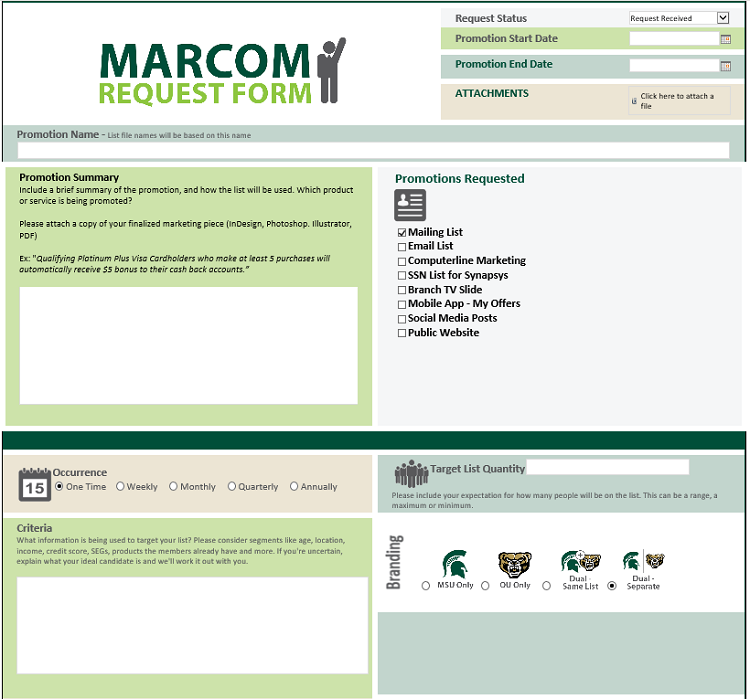
- Marketing: BI creates lists for marketing promotions and tracks the results. Marketing uses a custom request to compile the information needed to pull the list for the promotion. Upon submission, the request posts to the BI calendar for processing and a follow-up task is scheduled to report the results after the promotion. BI and marketing team members meet regularly to discuss trends, results, and ideas.
- Visa: MSUFCU has approximately $300 million in credit card balances and $200 million in monthly debit and credit card purchase volume. BI helps analyze the card activity to identify opportunities, mitigate fraud and credit losses, and engage inactive cardholders.
- Loans: BI creates a variety of reports to measure application volume, funding, and credit quality. BI develops these reports in cooperation with the lending teams to ensure the information is useful to manage volume, service, and risk.
- Members: The BI team tracks various demographic data points such as generation, location, product and channel usage, and credit score. Demographic data helps the credit union anticipate future financial services needs and remain relevant to the membership. This information is used for strategic decision-making, budgeting and forecasting, product development, and more.
- Intern: the BI intern works on projects based on course of study and current needs. This summer, the intern is working on a review of MSUFCU checking account offerings and comparing them to other options available in the market.
We worked with payment services to identify members who use our eDeposit feature to inform them of upcoming regulatory changes.
Lending does loan preapprovals on a quarterly basis, and BI helps to create the targeted lists for each offer. This year, we worked with lending to evaluate the results of these campaigns and made recommendations to more specifically target members meeting certain criteria. This reduced the number of offers mailed by 51% from 70,000 to 34,000 and improved the response rate from 1.96% to 2.66%. This change is expected to save $34,000 per year while producing similar results.
What projects have allowed the team to explore a question that interested them? Why is that important?
SD: Creating reports and analyzing data is likely to create as many questions as it answers. There have been several instances when BI built a report to answer one question and created three more questions. The team works on answering these questions in addition to their regularly assigned projects.
Some are small things that help to improve data integrity. Others provide insight that can be applied to a variety of other projects. One of our larger curiosity projects related to channel usage. This resulted in a model that tells us how many channels and which combinations a member has used in the past month, quarter, or year.
It’s important to have the team pursue these ideas as part of their work. Allowing the freedom to explore ideas provides opportunities for learning whether we find something that provides new insight into our membership or scrap the project because we didn’t. We learn just as much from projects that don’t work as we do from those that get incorporated into our reporting structure.
How does your BI team use predictive analytics?
SD: We’re just starting to build predictive models. One of the projects we worked on was using historical new account data, addresses, and address changes to predict what markets would be growing over the next 10 years. This helps us prioritize market areas for exploration/development.
We’re also working on a closed account model to help identify patterns in member behavior that indicate a member might close their accounts in the next year. We’re currently validating the results to determine how we can incorporate the model into our member retention strategy. One challenge for the team is recognizing that even if the model isn’t 100% accurate, the incremental opportunity to increase member retention is valuable.
What is the key to managing a group like this?
SD: There is a balance between brainstorming, collaboration, independent research, and analysis. We look for BI specialists who liked to dig into the data and identify questions to ask.
The key for us is being open to feedback and questions. When you’re building the report, you’re very familiar with the data source and any assumptions made. It’s important that the final product objectively presents the data to the end user.
As the BI specialists expand their knowledge, and progress in their roles, they take on more responsibility for making recommendations and presenting data to other departments and management.
4 Tips For BI Bliss
Effective business intelligence doesn’t happen in a vacuum. Here, MSUFCU’s Sara Dolan shares four best practices for empowering collaboration and, ultimately, informed decision-making.
- Ask so what? A chart or infographic can be beautiful, but the data must be presented in a way that the end user can make a decision.
- Foster collaboration. BI should not operate in a silo, distribute reports, and make recommendations without discussion and input from the appropriate departments.
- Foster transparency. MSUFCU has created an intranet page to share information with all employees, but we also discuss various data reports in meetings throughout the organization.
- Be curious and ask questions. Reflect on the data that is relevant to a decision and try to reduce the noise.
What’s one piece of advice to credit unions just getting started with analytics?
SD: It’s impossible to create a report that will answer every question. Analytics is likely to create as many questions as it answers. These new questions provide opportunities to dig deeper into the data.
It’s important to evaluate what is relevant data and what is noise. At the beginning of a project or report, it’s critical to clearly define the questions to answer or the performance to measure.
If you could start all over, where would you start?
SD: I’m happy with where our BI team is today. We started in 2014 with a team of two people and focused on the standard reports and dashboards first. In 2016, we created the four specialties. This has helped to develop specific knowledge and allocate projects more effectively. If I could go back, I would explain sooner the value of small incremental changes.
This interview has been edited and condensed.