Super Bowl LIX will kick off Sunday, Feb. 9 in New Orleans, and while this year’s championship game is a rematch of the 2023 contest, some big questions remain. Will the Philadelphia Eagles take home the Vince Lombardi Trophy for the second time in franchise history? Or will the Chiefs cement their legacy and pull off an unprecedented three-peat?
Using data from Peer Suite, Callahan & Associates can predict what will take place on the gridiron. By analyzing credit union data for each team’s home state, we can prognosticate on what to expect.
Growing Your Share Of The Scoreboard
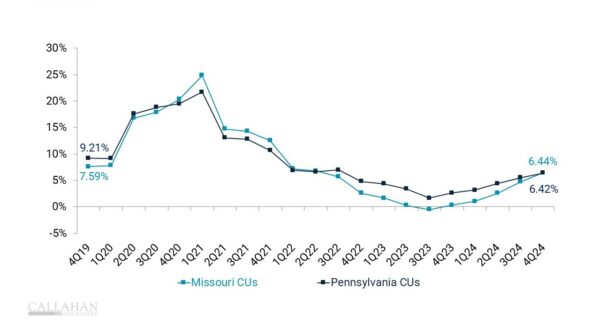
One of the keys to football is growing your “share” of points on the board. And when it comes to growing shares, both Missouri and Pennsylvania outshine the competition, bringing in shares at a higher rate than the national average. That’s what got them this far in the first place. However, recent inflation Jalen Hurts Pennsylvanians’ ability to save just a tad more. The first phase of the Super Bowl is a tight one, but Missouri squeaks just a hair ahead of Pennsylvania, winning by two basis points, 6.44% to 6.42%.
SHARE GROWTH
FOR U.S. CREDIT UNIONS
© Callahan & Associates | CreditUnions.com
Defending Operating Expenses Wins Championships
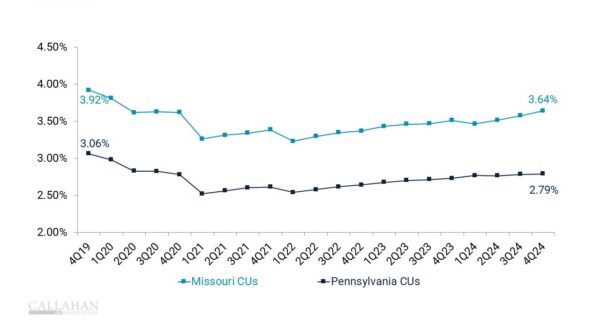
Vince Lombardi famously called football “a game of inches.” Another way to think of it is as a game of margins, and nothing eats into margins like operating expenses. Like the Kansas City defensive line against the Eagles’ vaunted quarterback sneak, a credit union must protect these margins. Keeping them in check can make or break a defense’s ability to stop the onrush of costs. Unfortunately, the Eagles are a lot better at these short-yardage situations. In this respect, Pennsylvania crushes Missouri, 2.79% to 3.64%.
OPERATING EXPENSE RATIO
FOR U.S. CREDIT UNIONS
© Callahan & Associates | CreditUnions.com
Return On Assets
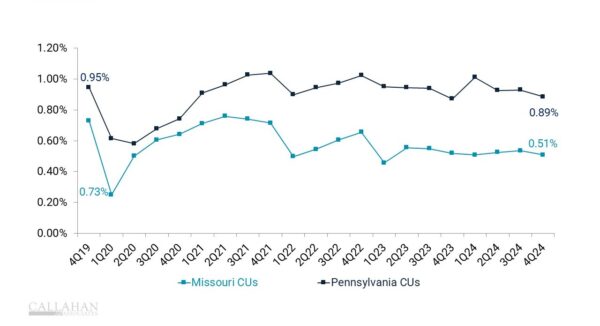
Ultimately what matters is how all the components fit together. Often a team wins a championship by being greater than the sum of its parts. That’s often true for credit unions as well. However, given our data limitations we can only look at the sum of parts to assess performance, and that’s why return on assets is the key metric in this simulation. Fortunately for Philadelphia, they won’t need to Josh-Sweat this one out, as they Fly Eagles Fly all the way to the Lombardi Trophy. Pennsylvania credit unions win the last leg, 0.89% to 0.51%.
ROA
FOR U.S. CREDIT UNIONS
© Callahan & Associates | CreditUnions.com
There you have it! The Eagles win Super Bowl LIX and prevent the Kansas City Chiefs from claiming a historic three-peat.
Want A Look Back At Last Year’s Match Up? Click here to see how credit union performance data measured up against in Super Bowl LVIII, when the Chiefs faced off against the 49ers.
Championship-Worthy Performance Starts With The Right Data
Just like winning teams rely on game plans and stats to power their victories, credit union leaders need data-driven insights to make smart plays, too. Callahan’s Peer Suite provides key performance metrics — including share growth, operating expense ratios, ROA, and more —so you can see how your credit union stacks up on the field. Request a free 1:1 performance review comparing your institution against peers with a Callahan expert and receive a custom benchmarking report.
Request Your Free Review