A well-run institution knows the key metrics to consider when pricing a loan. Cost of funds, capital requirements, administrative costs, default or loss assumptions these all help an institution properly price and manage its loan portfolio.
But how should a credit union begin the process? After calculating cost assumptions should they look at the relationship with the member? How much value do they place on the relationship? Should they look at other institutions to ensure they are providing a competitive rate for a similar product?
To price a loan, credit unions need to understand that the basic pricing model for loan rates is derived from the U.S. Treasury yield curve. Also known as the term structure of interest rates, the yield curve shows the yield or rate that investors will receive for lending money based on different maturities with similar credit profiles.
Financial institutions use the U.S. Treasury yield curve to price their savings and loan rates because U.S. government securities are deemed to have no credit risk. The yield curve components range from very short Treasury bills to 30-year bonds.
What Does A Yield Curve Look Like?
There are three types of yield curves:
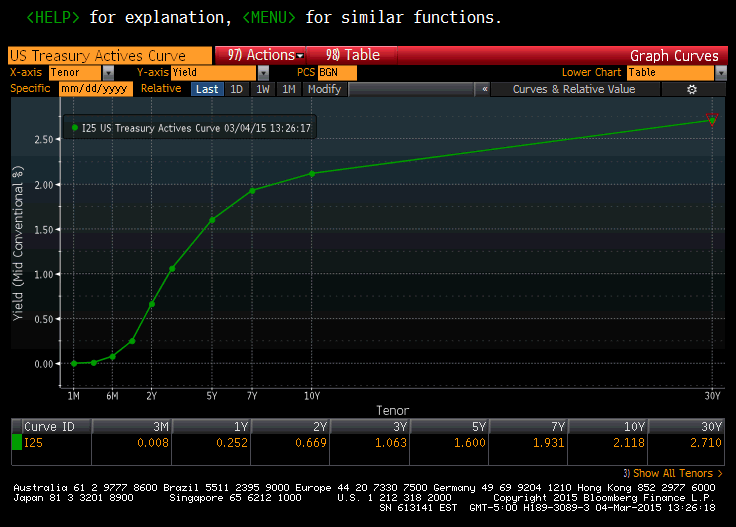
1. Positive/Normal. A positive or normal yield curve has an upward-sloping graph where short-term rates are lower than long-term rates. The U.S. Treasury yield curve from March 4, 2015, below shows that short-term rates are yielding less than long-term rates. For example, the two-year rate is 0.67% and the 10-year rate is 2.12%.

Source: Bloomberg
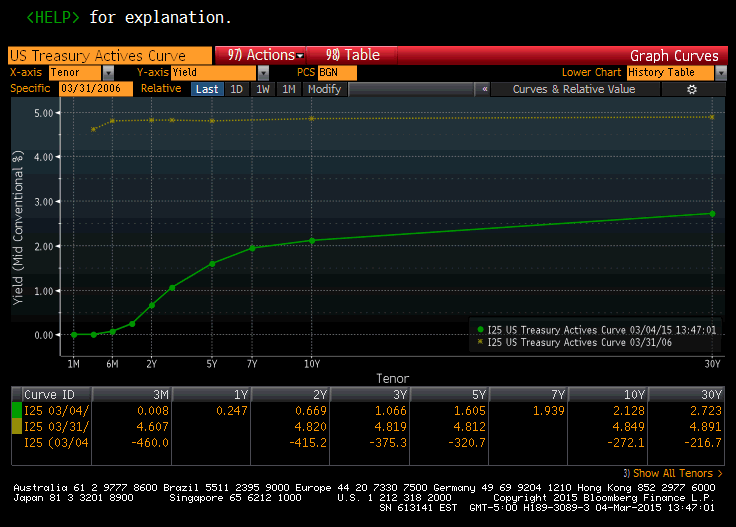
2. Flat: In a flat yield curve there is little or no difference between short-term and long-term rates. The graph below depicts the yield curve on March 31, 2006, compared with the current yield curve. The yield on the Treasury two-year was 4.82% and the yield on the Treasury 10-year was 4.85. This is typically followed by an inverted yield curve.

Source: Bloomberg
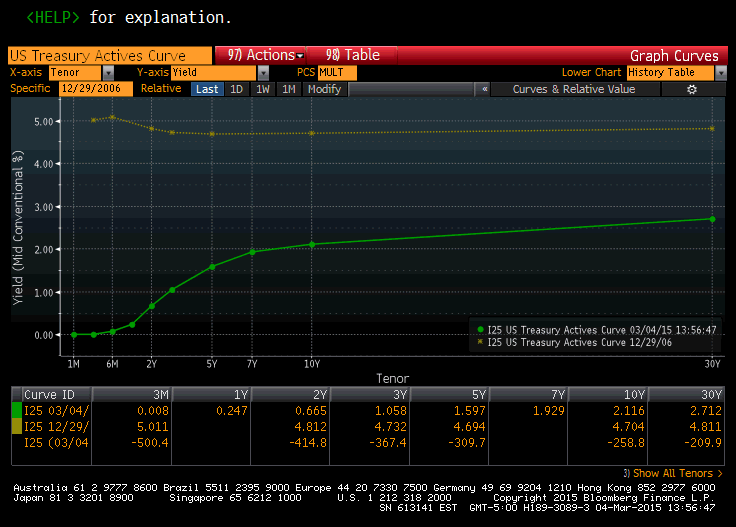
3. Negative/Inverted: In a negative or inverted yield curve, long-term rates are lower than short-term rates. When the curves inverts, it is a pretty reliable indicator that a recession is imminent. The last time the yield curve inverted was Dec. 29, 2006; in 2007, the housing market crashed. The graph below shows the inverted yield curve on top and the current yield curve below. At the end of 2006, the yield on the Treasury two-year was 4.81% and the yield on the Treasury 10-year was 4.70%, resulting in a difference of -11 basis points.

Source: Bloomberg
What Does This Mean For Pricing Loans?
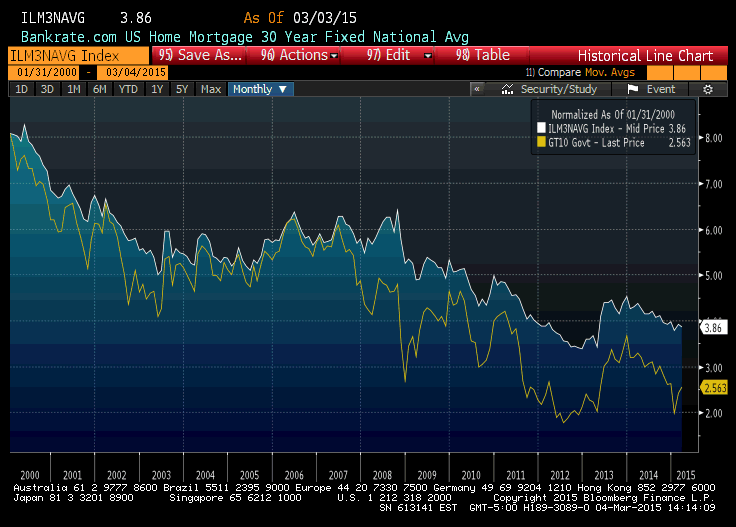
Typically, a lender will price an auto loan or adjustable rate mortgage off short-term rates, one to five years depending on the term of the loan. Lenders typically price long-term, 30-year mortgages off the U.S. 10-Year Treasury note. The graph below tracks 30-year mortgage rates versus the 10-year Treasury since Jan. 1, 2000. As evident, they are highly correlated. From 2003 through 2006, they seem to be exactly the same. That is usually when there is heavy refinancing activity and 30-year mortgages have a shorter life expectancy.

Source: Bloomberg
For credit unions, it is important to understand basic yield curve dynamics when pricing loans. There are many other factors to consider when pricing a loan, but a basic understanding of why rates are where they are will allow an institution to properly manage the loan portfolio and remain competitive in the market place.
Kevin Heal is vice president of Callahan Financial Services (www.TRUSTcu.com). He has more than 25 years of sales and trading experience with both large investment banks and regional broker-dealers.
The Price Is Right
A well-run institution knows the key metrics to consider when pricing a loan. Cost of funds, capital requirements, administrative costs, default or loss assumptions these all help an institution properly price and manage its loan portfolio.
But how should a credit union begin the process? After calculating cost assumptions should they look at the relationship with the member? How much value do they place on the relationship? Should they look at other institutions to ensure they are providing a competitive rate for a similar product?
To price a loan, credit unions need to understand that the basic pricing model for loan rates is derived from the U.S. Treasury yield curve. Also known as the term structure of interest rates, the yield curve shows the yield or rate that investors will receive for lending money based on different maturities with similar credit profiles.
Financial institutions use the U.S. Treasury yield curve to price their savings and loan rates because U.S. government securities are deemed to have no credit risk. The yield curve components range from very short Treasury bills to 30-year bonds.
What Does A Yield Curve Look Like?
There are three types of yield curves:
1. Positive/Normal. A positive or normal yield curve has an upward-sloping graph where short-term rates are lower than long-term rates. The U.S. Treasury yield curve from March 4, 2015, below shows that short-term rates are yielding less than long-term rates. For example, the two-year rate is 0.67% and the 10-year rate is 2.12%.
Source: Bloomberg
2. Flat: In a flat yield curve there is little or no difference between short-term and long-term rates. The graph below depicts the yield curve on March 31, 2006, compared with the current yield curve. The yield on the Treasury two-year was 4.82% and the yield on the Treasury 10-year was 4.85. This is typically followed by an inverted yield curve.
Source: Bloomberg
3. Negative/Inverted: In a negative or inverted yield curve, long-term rates are lower than short-term rates. When the curves inverts, it is a pretty reliable indicator that a recession is imminent. The last time the yield curve inverted was Dec. 29, 2006; in 2007, the housing market crashed. The graph below shows the inverted yield curve on top and the current yield curve below. At the end of 2006, the yield on the Treasury two-year was 4.81% and the yield on the Treasury 10-year was 4.70%, resulting in a difference of -11 basis points.
Source: Bloomberg
What Does This Mean For Pricing Loans?
Typically, a lender will price an auto loan or adjustable rate mortgage off short-term rates, one to five years depending on the term of the loan. Lenders typically price long-term, 30-year mortgages off the U.S. 10-Year Treasury note. The graph below tracks 30-year mortgage rates versus the 10-year Treasury since Jan. 1, 2000. As evident, they are highly correlated. From 2003 through 2006, they seem to be exactly the same. That is usually when there is heavy refinancing activity and 30-year mortgages have a shorter life expectancy.
Source: Bloomberg
For credit unions, it is important to understand basic yield curve dynamics when pricing loans. There are many other factors to consider when pricing a loan, but a basic understanding of why rates are where they are will allow an institution to properly manage the loan portfolio and remain competitive in the market place.
Kevin Heal is vice president of Callahan Financial Services (www.TRUSTcu.com). He has more than 25 years of sales and trading experience with both large investment banks and regional broker-dealers.
Daily Dose Of Industry Insights
Stay informed, inspired, and connected with the latest trends and best practices in the credit union industry by subscribing to the free CreditUnions.com newsletter.
Share this Post
Latest Articles
Credit Union Data Predicts Who Will Win Super Bowl 2026
140 Million Reasons To Lend
Rethinking Auto Lending And The Choices Facing Credit Union Leaders
Keep Reading
Related Posts
Financial Nihilism Is Real, But How Can Credit Unions Respond?
2026 Begins With Market Sentiment Similar To 2025
Preparing For 2026: Why The NCUA’s New Succession Planning Rule Elevates The Strategic Role Of Credit Union Boards
140 Million Reasons To Lend
Aaron PassmanRethinking Auto Lending And The Choices Facing Credit Union Leaders
What Credit Unions Can Do NOW To Launch And Expand Student Lending Programs
View all posts in:
More on: