Rising interest rates and a slowdown in economic growth have taken a toll on asset quality.
Delinquency and net charge-offs — especially in credit cards and used auto loans — have risen rapidly in the past year, according to Callahan & Associates’ analysis of first-quarter data from the National Credit Union Administration. Of note, however, is that delinquency rates hit record lows during the pandemic, and this deterioration represents a return to historical levels.
To better manage asset quality while still supporting members, credit unions will need to carefully monitor their loan portfolios and be prepared to take action. The following metrics offer a solid place to start.
NET CHARGE-OFF RATIO AND DELINQUENCY RATIO
FOR U.S. CREDIT UNIONS | DATA AS OF 03.31.24
© CALLAHAN & ASSOCIATES | CREDITUNIONS.COM
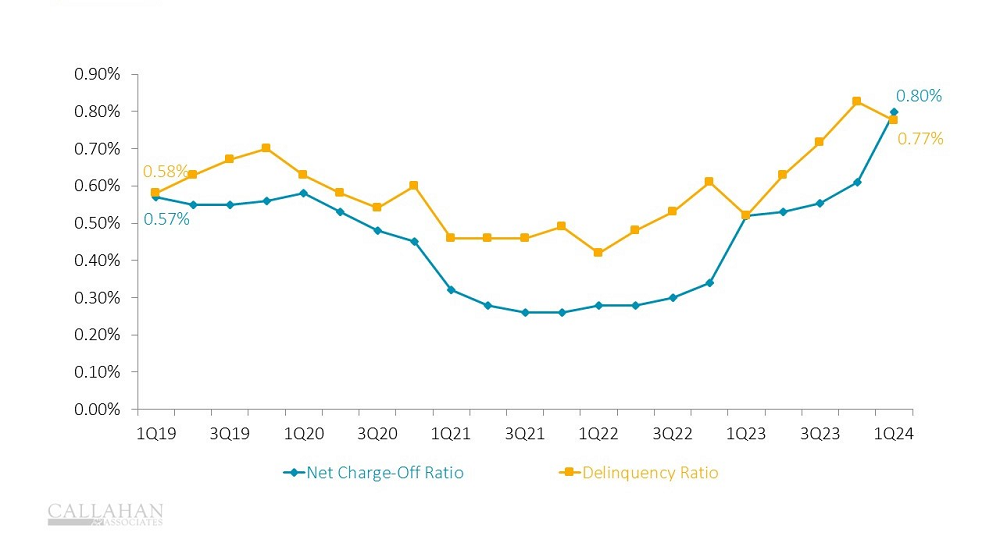
- At first glance, delinquency appears to have improved in the first quarter of 2024; however, this is largely the result of a significant spike in net charge-offs. After all, a loan cannot be delinquent if it has been written off and moved into collections. Overall, net charge-offs increased more than delinquencies fell. Consequently, the asset quality ratio climbed 13 basis points quarter-over-quarter. Year-over-year it climbed 53 basis points.
- Delinquency was down 6 basis points from the end of 2023 but remained 25 basis points higher than first quarter 2023. Net charge-offs, on the other hand, were higher on both fronts — 19 basis points from year-end and 28 points from first quarter 2023. For the first time in more than 20 years, the net charge-off ratio surpassed the delinquency ratio.
Is Asset Quality Keeping You Up At Night? Don’t lose sleep over delinquencies. Callahan’s Peer Suite helps leaders monitor loan portfolios and prepare a plan of action. Dig into your credit union’s performance with a free asset quality scorecard, and enjoy peace of mind at the click of a button. Request Your Free Asset Quality Scorecard.
DELINQUENCY BY PRODUCT
FOR U.S. CREDIT UNIONS | DATA AS OF 03.31.24
© CALLAHAN & ASSOCIATES | CREDITUNIONS.COM
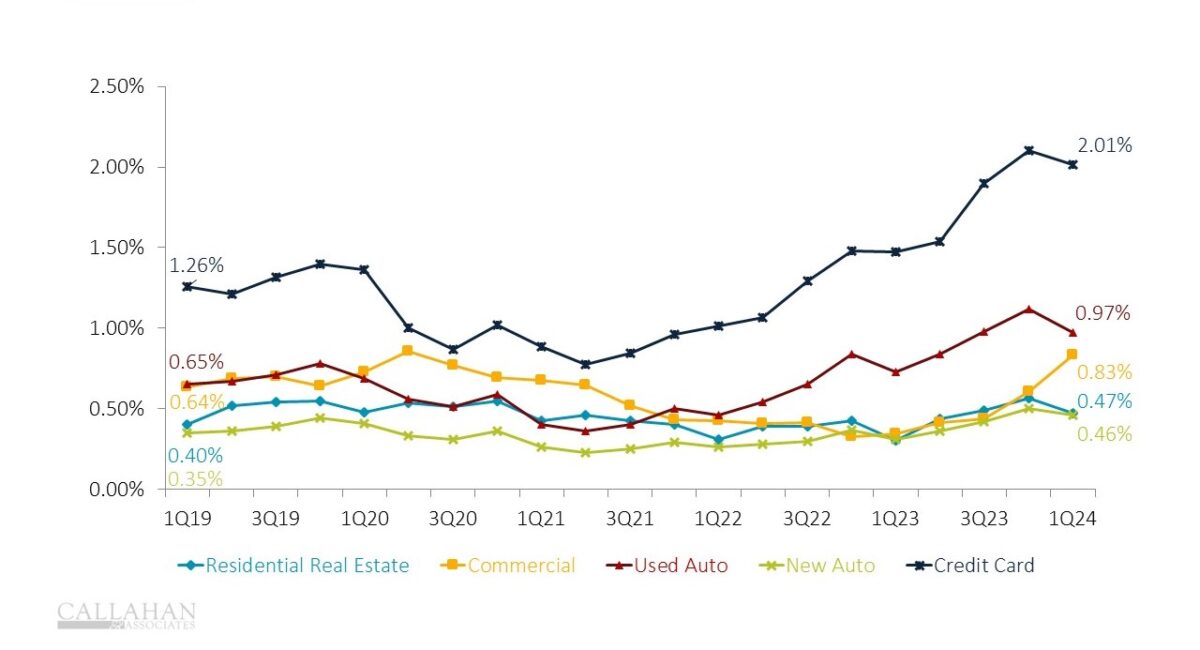
- Delinquency was down on a quarterly basis across most of the portfolio. In addition to the charge-offs mentioned above, tax returns and more conservative post-holiday spending helped borrowers make timely payments or pay off past due loans. Commercial delinquency was up 23 basis points, the only loan type to increase since year-end.
- Delinquency increased on an annual basis, however, particularly in credit cards. Credit card delinquency surged 53 basis points annually, which might indicate members are struggling to make everyday purchases under stretched budgets. Credit card delinquency has returned to a post-Great Recession rate of 2.02%. Still, this is down slightly from the record-high 2.10% recorded first quarter 2024. In the consumer portfolio, used auto delinquency came in second place with a 24-basis-point annual increase. Delinquency in all other loan types remain well-below the peak rates of the late 2000s.
COVERAGE RATIO
FOR U.S. CREDIT UNIONS | DATA AS OF 03.31.24
© CALLAHAN & ASSOCIATES | CREDITUNIONS.COM
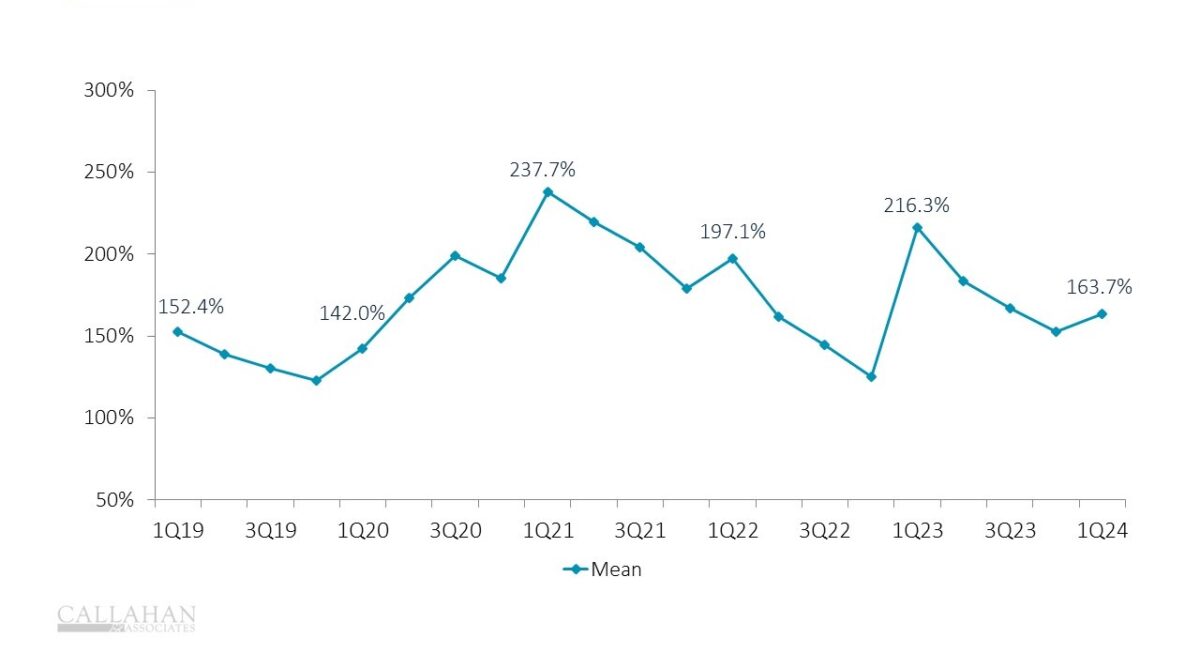
- Asset quality showed signs of degradation in the first quarter, but credit unions fired back by increasing allowances to start 2024. In the first three months of 2024, the industry added another $3.2 billion of provisions, less than the $3.9 billion added last quarter, but still one of the largest quarterly contribution amounts on record. As of March 31, the industry has set aside $1.64 for every $1.00 of currently delinquent loans.
- It is important to note the impact of CECL accounting policy on this ratio, which can be seen most dramatically in the 1Q23 jump in the above graph, following the NCUA’s full CECL implementation. Credit unions are now obliged to set aside money to cover forecasted future losses, not just cover loans that are currently struggling.
- While the current 164% delinquency coverage ratio is historically strong, this ratio could shrink quickly if asset quality degradation persists. Such a dynamic would place pressure on industry earnings and increase regulatory oversite. Credit unions must be careful to proactively build an appropriate allowance based on their respective loan portfolios, risk forecasting models, and membership’s expected financial profile over the coming years. Learn more about the industry’s CECL practices here: https://creditunions.com/highlights/cecl-a-half-baked-cake/