Callahan’s FirstLook data, representing 6,000 credit unions and 98% of industry assets, points toward another record-breaking quarter and remarkable year for the credit union industry.
Membership, loan balances, and share balances posted all-time highs. As of Dec. 31, 2015, credit unions served more than 104 million members and held $797 billion in loans. Loan originations soared 15.9% annually.
Here are three things to know about loan originations in 2015.
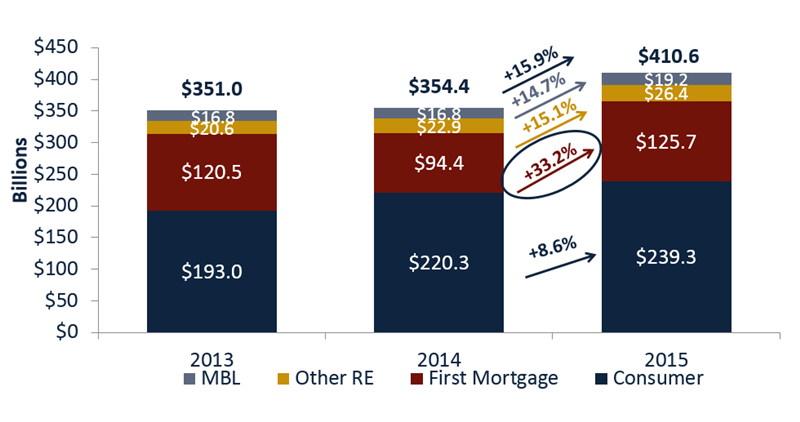
No. 1: Credit unions lent more than $410 billion to members in 2015, up 15.9% annually.
Consumer loans comprised 58.3% of the loan origination portfolio. That’s down 3.9 percentage points from 62.2% in December 2014. First mortgage originations posted the highest growth of all loan categories, up 33.2% annually. They comprised 30.6% of all loans originated throughout the year.
YEAR-TO-DATE LOAN ORIGINATIONS
For FirstLook credit unions | Data as of 12.31.15
© Callahan & Associates | www.creditunions.com
Source: Peer-to-Peer Analytics by Callahan & Associates
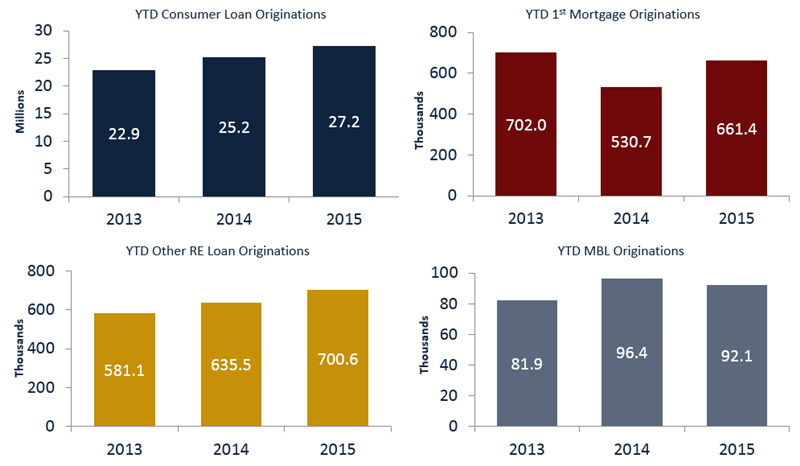
No. 2: By number, consumer loans accounted for 94% of loan originations in 2015.
Credit unions originated more than 28.7 million loans in 2015 — 27.2 million were consumer loans. Three of the four loan categories posted an increase in number of loans originated year-over-year. The fourth category, member business loans, posted a 4.4% decrease in number of loans originated since December 2014; however, MBL balances were up 13.3% annually.
YEAR-TO-DATE NUMBER OF LOAN ORIGINATIONS BY TYPE
For FirstLook credit unions | Data as of 12.31.15
© Callahan & Associates | www.creditunions.com
Source: Peer-to-Peer Analytics by Callahan & Associates
No. 3: Yearly growth in the number of loans originated topped 20% for four states.
Credit unions in the District of Columbia posted impressive growth, expanding the number of loans originated by 49.3% in 2015.
LEADERS IN GROWTH OF LOAN NUMBERS ORIGINATED
For FirstLook credit unions | Data as of 12.31.15
© Callahan & Associates | www.creditunions.com
| State | Total Number Of Originations For 2015 (in thousands) |
Total Number Of Originations For 2014 (in thousands) |
Growth |
|---|---|---|---|
| DC | 99,215 | 66,468 | 49.3% |
| FL | 2,916,210 | 2,118,772 | 37.6% |
| HI | 130,666 | 102,930 | 27.0% |
| NJ | 215,216 | 172,312 | 24.9% |
| RI | 45,022 | 37,564 | 19.9% |
| MA | 172,258 | 145,992 | 18.0% |
| WA | 756,603 | 642,107 | 17.8% |
| MN | 449,247 | 386,126 | 16.4% |
| CO | 382,567 | 332,060 | 15.2% |
| VA | 4,188,245 | 3,685,947 | 13.6% |
Source: Peer-to-Peer Analytics by Callahan & Associates
No. 4: Yearly growth in loan origination balances topped 20% for nine states.
Nevada credit unions outpaced all other states in origination growth, increasing the dollar amount of loans originated by 39.2% compared to December 2014.
LEADERS IN GROWTH OF LOAN BALANCES ORIGINATED
For FirstLook credit unions | Data as of 12.31.15
© Callahan & Associates | www.creditunions.com
| State | Total Origination Balances For 2015 (in thousands) | Total Origination Balances For 2014 (in thousands) | Growth |
|---|---|---|---|
| NV | $1,321,707 | $949,765 | 39.2% |
| HI | $2,047,767 | $1,534,211 | 33.5% |
| CO | $8,987,803 | $6,747,615 | 33.2% |
| RI | $1,522,011 | $1,157,533 | 31.5% |
| MD | $6,691,368 | $5,185,355 | 29.0% |
| MN | $6,329,227 | $5,006,964 | 26.4% |
| CT | $2,442,427 | $1,946,380 | 25.5% |
| AL | $4,603,732 | $3,679,894 | 25.1% |
| ID | $3,982,429 | $3,186,574 | 25.0% |
| MA | $9,850,896 | $7,941,384 | 24.0% |
Source: Peer-to-Peer Analytics by Callahan & Associates