Interested in comparing the generational breakdown of one credit union’s mortgage portfolio against another’s? Interested in learning whether a mortgage team is maximizing efficiency and closing as many loans as approved? Interested in exploring what portion of a credit union’s mortgages are purchases versus refinances? Find the answer to these questions and more by diving into the data reported under the Home Mortgage Disclosure Act (HMDA).
HMDA requires lending institutions that meet certain criteria to report mortgage origination information. All credit unions, banks, savings associations, and other mortgage lending companies must report HMDA data if they meet all the following criteria: have $45 million or more in assets, and have a branch or home office in a metropolitan statistical area, and originated at least 25 closed-end mortgage loans in the prior two calendar years or originated at least 500 open-end lines of credit in the prior two calendar years.
According to the most recent HMDA data set released by the FFIEC, mortgage production in the United States approached $2.7 trillion at year-end 2019. Credit unions accounted for $184.6 billion, or 6.9%, of the total market. In combination with 5300 Call Report data, HMDA data in Callahan’s Peer-to-Peer software allows users to analyze mortgage data on an institution level and in several different ways.
Here are four ways credit union can use HMDA data to improve their mortgage business.
No. 1: BENCHMARK the funding-to-approval ratio.
Credit union performance ratios enable credit unions to benchmark themselves against other institutions in the surrounding market. A credit union that has a lower than average funding-to-approval ratio would want to re-examine its pricing strategies or operational practices to determine whether they are contributing to higher abandonment. The average percentage of total applications funded for HMDA reporting credit unions across the country was 90.1% as of year-end 2019, and 95.6% for HMDA reporting banks.
PERCENT OF APPLICATIONS FUNDED
HMDA REPORTING CREDIT UNIONS | DATA AS OF 12.31.19
Callahan & Associates | CreditUnions.com
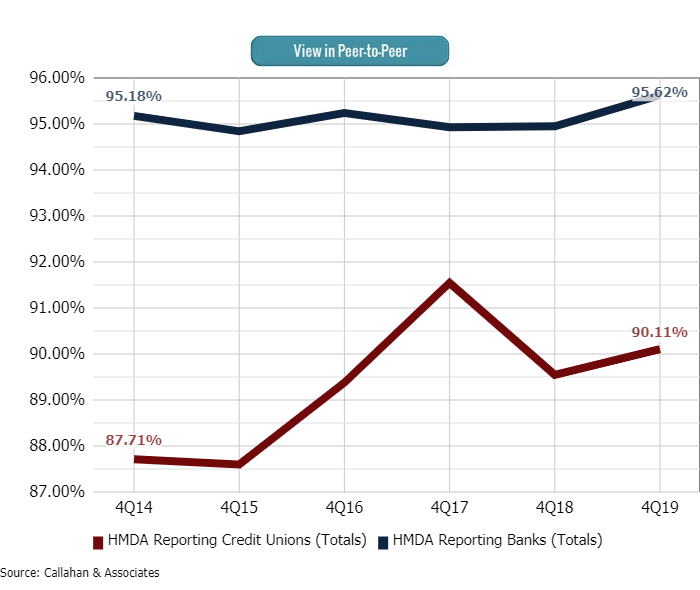
The funding-to-approval rating for credit unions across the country increased 56 basis points in a year to 90.1% by Dec. 31, 2019.
No. 2: IDENTIFY opportunities for new product offerings.
HMDA data captures the wide breadth of mortgage financing credit unions are extending to members. For example, loan funding volume by loan purpose includes purchase, refinance, and home improvement; loan type includes conventional, FHA, VA, and FSA; lien type includes first and subordinate; and occupancy status includes owner occupied and non-owner occupied. Data like this helps credit unions identify new products that could be popular based on the product composition in their market.
LEADERS IN CLOSED-END MORTGAGES BY TYPE
HMDA REPORTING CREDIT UNIONS | DATA AS OF 12.31.19
Callahan & Associates | CreditUnions.com
| Rank | State | Name | FHA Loans Funded ($) | VA Loans Funded ($) | FSA/RHA Loans Funded ($) |
|---|---|---|---|---|---|
| 1 | VA | Navy | $270,825,000 | $10,525,605,000 | $0 |
| 2 | MI | Lake Michigan | $118,095,000 | $47,700,000 | $11,305,000 |
| 3 | ID | Idaho Central | $102,155,000 | $62,385,000 | $8,335,000 |
| 4 | IN | Evansville Teachers | $80,400,000 | $27,050,000 | $16,130,000 |
| 5 | VA | Virginia | $55,835,000 | $16,575,000 | $3,175,000 |
| 6 | TX | University | $43,050,000 | $0 | $195,000 |
| 7 | UT | Mountain America | $42,610,000 | $28,645,000 | $7,470,000 |
| 8 | NY | Bethpage | $40,320,000 | $680,000 | $0 |
| 9 | PA | Members 1st | $39,795,000 | $16,000,000 | $4,600,000 |
| 10 | CO | Ent | $37,930,000 | $190,045,000 | $0 |
No. 3: EVALUATE secondary market purchasers.
Selling mortgages to the secondary market can help credit unions mitigate risk in a changing rate environment and can open opportunities to serve more members. In 2019, HMDA reporting credit unions sold $55.9 billion, or 35.9%, of originated mortgages to the secondary market. The largest purchaser of credit union mortgage loans was Fannie Mae, which bought 41.5% of originations sold. Through the first quarter of 2020, credit unions have sold $18.2 billion first mortgages accounting for 36.0% of total mortgage originations.
SECONDARY MARKET PURCHASER COMPOSITION
HMDA REPORTING CREDIT UNIONS | DATA AS OF 12.31.19
Callahan & Associates | CreditUnions.com
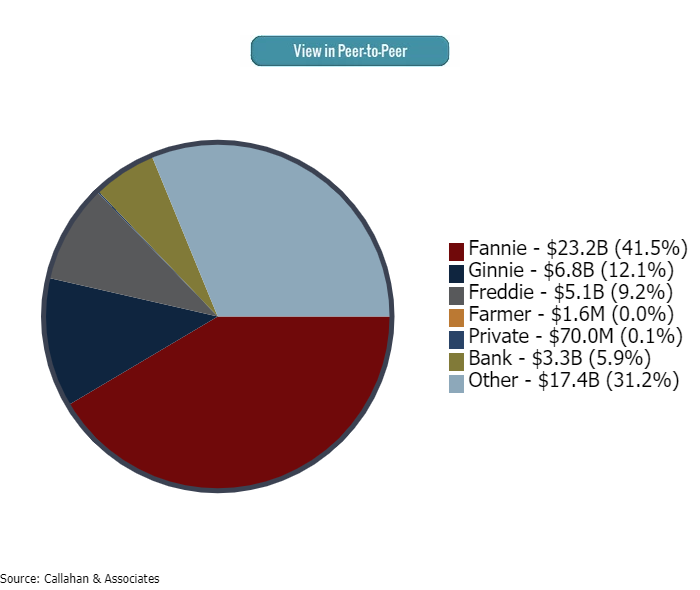
HMDA reporting credit unions sold $23.2 billion to Fannie Mae in 2019.
No. 4: ASSESS a credit union’s presence in the millennial market.
Trends in mortgage market share across age ranges highlight the differences in mortgage borrowing across generations. Armed with this data, credit unions can devise strategies to target specific segments within a broader membership base. As of Dec. 31, 2019, HMDA reporting credit unions in Iowa held the highest concentration of borrowers between the ages 25-45 54.1% of all closed-end loans funded.
BORROWER AGE COMPOSITION
IA HMDA REPORTING CREDIT UNIONS | DATA AS OF 12.31.19
Callahan & Associates | CreditUnions.com
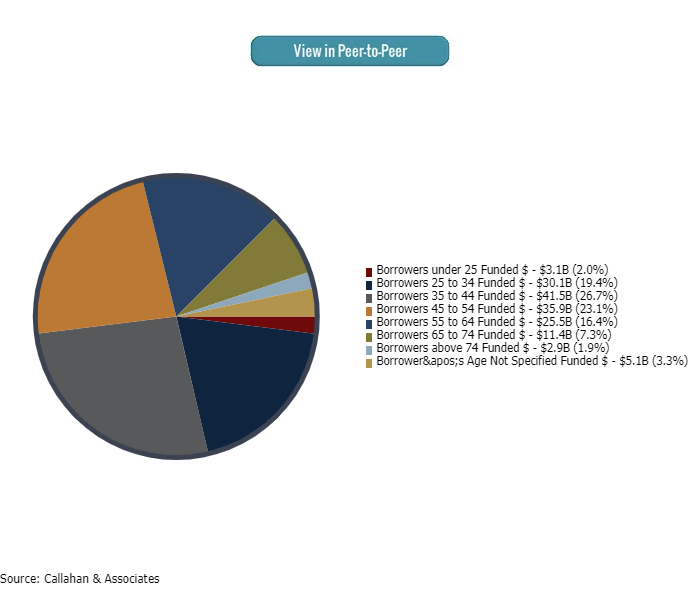
26.7% of closed-end mortgage recipients in Iowa were between 34 and 44 years old.
For more information about how to analyze HMDA data in Peer-to-Peer, check out Callahan’s one-page tip sheet. To make the analysis even easier, the firm has created a HMDA Reporting Credit Unions peer group in Peer-to-Peer. This group contains all credit unions that have reported at least one closed-end mortgage application. To explore HMDA data for specific markets down to the county or MSA level, see Callahan’s MortgageAnalyzer tool.
Request A Mortgage Market Intelligence Scorecard
Request a custom Mortgage Lending Intelligence Scorecard, made just for your credit union. Using the Home Mortgage Disclosure Act (HMDA) data, we’ll include the peer group (of your choice) and show key metrics like funding ratios, breakdown of loan type, and loan purpose.
Already a Callahan Client? Log in to start analyzing your own data.
Request Now