Read the full analysis or skip to the section you want to read by clicking on the links below.
- DEPOSITS
- MEMBERS
- MORTGAGES
- CREDIT CARDS
- LENDING
- BUSINESS LENDING
- AUTO LENDING
- EARNINGS
Credit unions posted 18 consecutive quarters of double-digit growth in auto lending as of year-end 2017. Year-over-year auto loan growth slowed slightly since Dec. 31, 2016, but remained in the double-digits at 11.3%. Auto loans in the credit union portfolio reached $335.9 billion in the fourth quarter.
Used auto loans comprised the larger share of the auto loan portfolio; however, used auto growth is slowing whereas the demand for new auto loans is growing. Over the past five years, the share of the auto portfolio held by used autos has fallen 4.2% to 60.3% as of Dec. 31, 2017. The share for new auto loans has increased 4.3% in that time to 39.7% at year-end. In the past 12 months alone, the share of new autos has grown 13.1%.
ContentMiddleAd
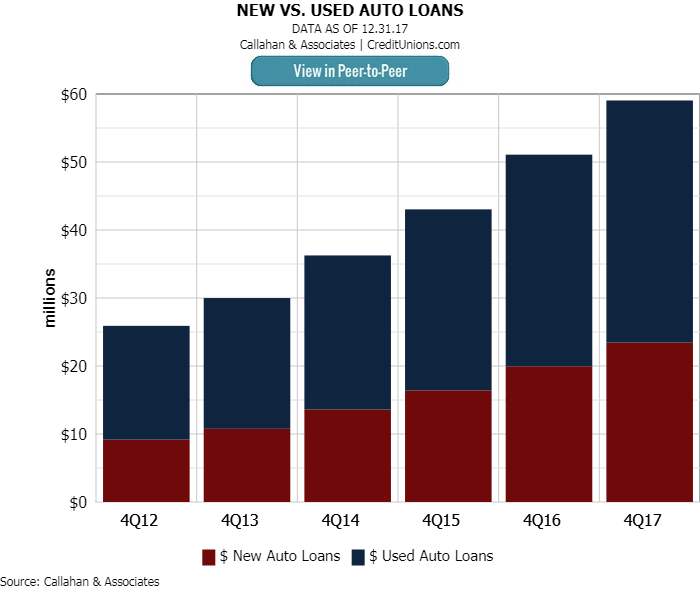
As total auto loans grow in share, new auto loans outpace used auto loans in year-over-year growth.
Auto loans accounted for 34.7% of total lending at credit unions. Their share of the loan portfolio trailed behind first mortgages, the largest component of the portfolio, by only 6.1%.
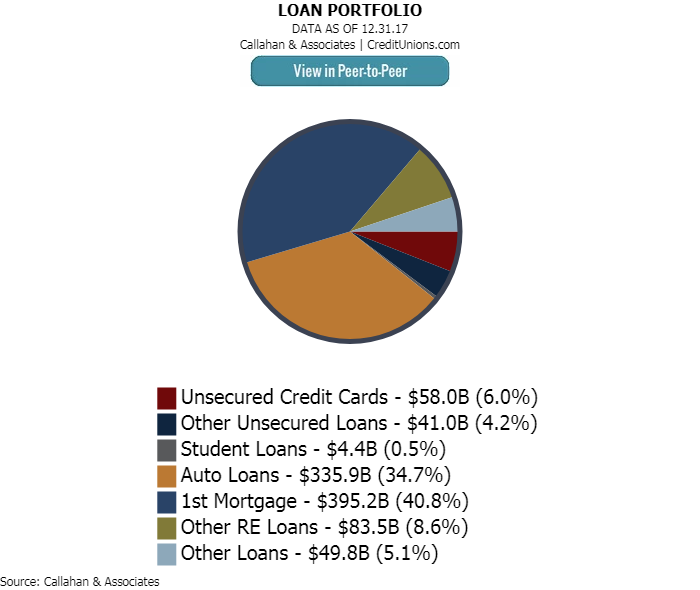
Auto loans make up the second largest portion of the credit union loan portfolio.
The share of auto loans in the credit union loan portfolio has expanded nearly 5.0 percentage points over the past five years. It reached 34.7% as of Dec. 31.
Indirect lending has been a major contributor to this rapid increase. The channel accounted for 58.3% of total auto loans at year-end 2017. Indirect lending expanded 17.7% year-over-year and reached $195.7 billion, a slight tick down from 21.1% in fourth quarter 2016.
In contrast, total direct loans total loans less indirect increased by 3.4%.
Credit unions with less than $20 million in assets held the highest share of auto loans, 54.0%, in their portfolio. At the other end, auto loans at credit unions with more than $1 billion in assets accounted for 32.4% of the portfolio. Auto loan share within the other asset classes varied around the industry average of 34.7%.
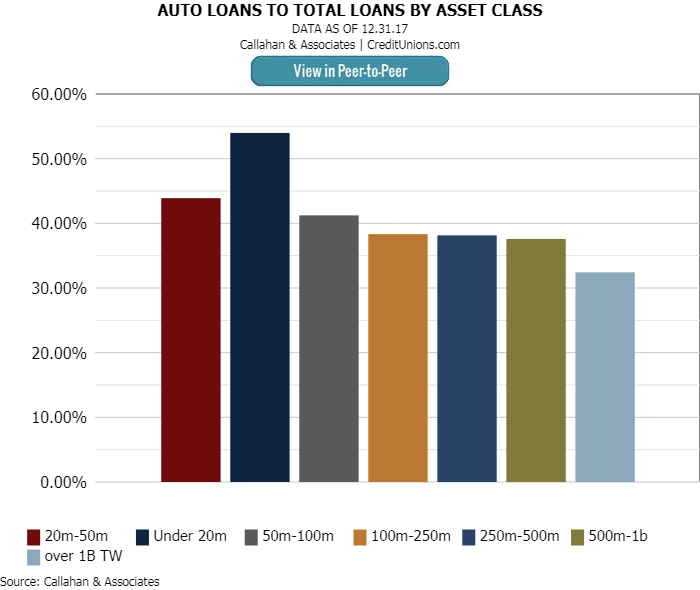
Credit unions under $20 million, are heavier on the auto lending share of the portfolio than credit unions over $1 billion.
Auto loan penetration was up 4.4% from five years ago and reached an all-time industry high of 20.5% as of Dec. 31, 2017.
Credit unions in the Central Region reported the highest auto loan penetration, 24.8%. That is 4.3% higher than the national average. Credit unions in the Western Region follow with an auto loan penetration of 22.3%. After that, it’s credit unions in the Southeast at 20.6%, New England at 18.0%, and the Mid-Atlantic at 16.2%.
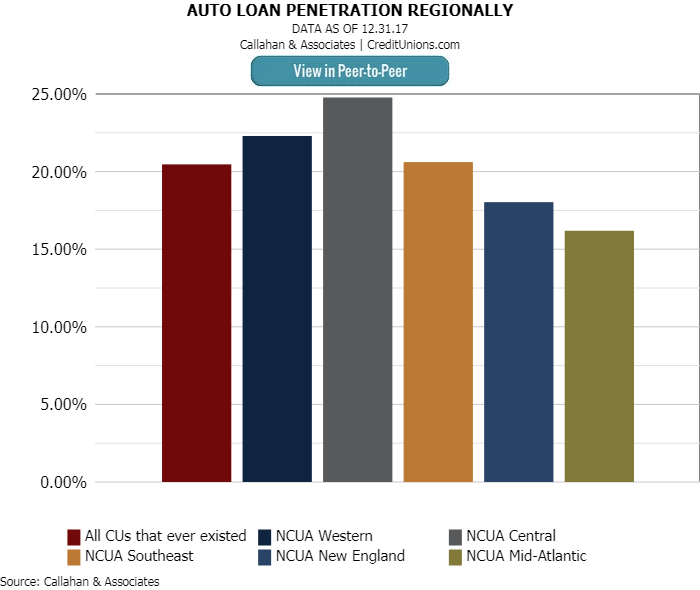
More credit unions in the central region take advantage of auto lending at their local credit unions.
Auto loan delinquency fell 2 basis points to 0.70% as of Dec. 31, 2017, two basis points lower than one year ago. Auto loan net charge-offs increased by 5 basis points from 0.61% to 0.66.