The credit union loan portfolio is on track to surpass $1 trillion, according to available third quarter performance data representing more than 99% of the industry’s assets. That’s a jump of 9.7% since Sept. 30, 2017; however, the annual growth rate has slowed slightly from the 10.5% recorded one year ago.
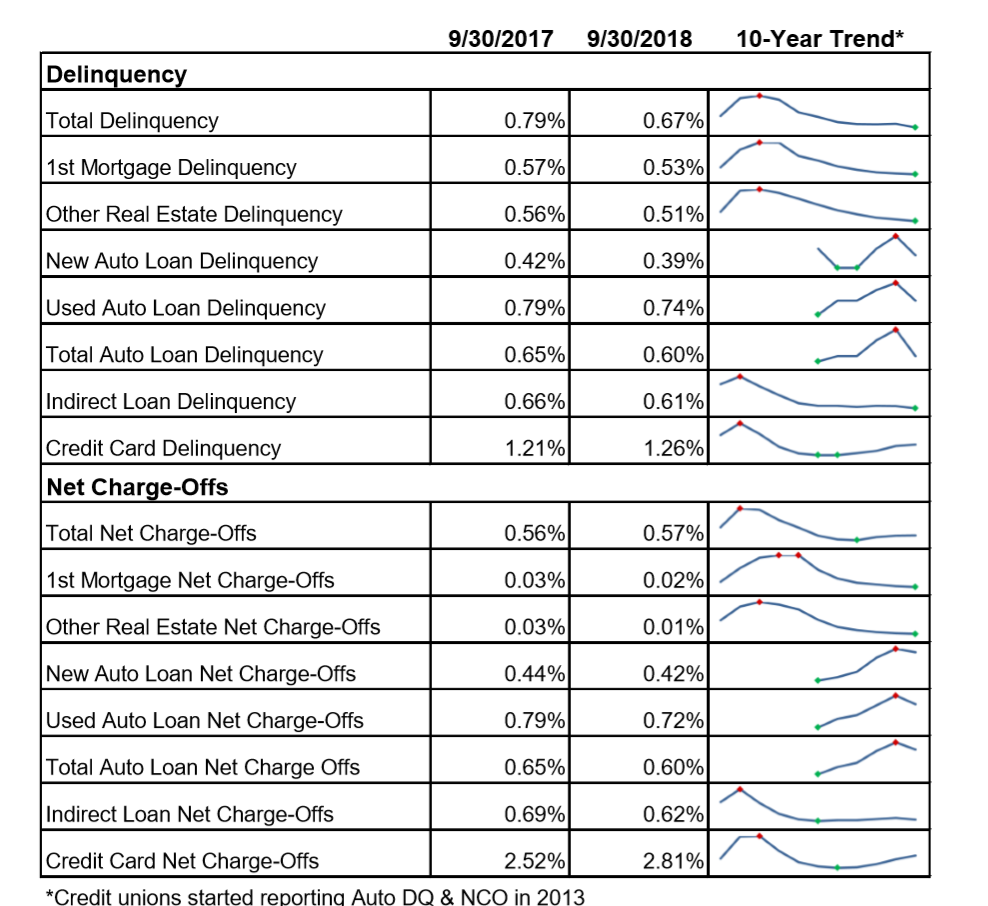
Notably, the growing loan portfolio has not introduced a decline in asset quality. Callahan & Associates projects overall delinquency has declined 12 basis points in the past 12 months to 0.67%. Over the past 10 years, asset quality has improved substantially. Net charge-offs and delinquency are down 60 and 97 basis points, respectively, to 0.57% and 0.67%.
DELINQUENCY AND NET CHARGE-OFFS
FOR U.S.CREDIT UNIONS | DATA AS OF 09.30.18

Callahan & Associates projects overall delinquency has declined 12 basis points in the past 12 months to 0.67%. Over the past 10 years, Net charge-offs and delinquency are down 60 and 97 basis points, respectively, to 0.57% and 0.67%.
Source: Callahan & Associates.
Credit card loan balances are on pace to hit $59.5 billion with an average credit card loan balance of $2,952 as of Sept. 30. At 31.3%, credit card utilization is down 134 basis points from five years ago. Over the same period, unfunded credit card commitments have increased 53.9% while the actual dollar amount of credit card loans has increased 44.7%, meaning limit expansion is outpacing draws. From third quarter 2017 to third quarter 2018, credit card delinquency increased 5 basis points to 1.25%. For comparison, delinquency increased 17 basis points from third quarter 2016 to third quarter 2017.
For available third quarter data, auto loans account for 35.2% of the total loan portfolio. First mortgages comprise the largest piece of the portfolio; however, auto loans come in at No. 2. These are the only two segments of the loan portfolio in which credit unions have reported accelerating growth rates. Auto loans are the only segment of the portfolio to record double-digit growth 10.0% with new auto loans increasing 12.5% and used auto loans increasing 9.8%. Five years ago, credit unions captured 14.7% of the U.S. auto finance market. In the third quarter of 2018, credit unions funded one out of every five, or 20.6% of the market, according to Experian Automotive.
Performance Analysis Made Easy
The credit union loan portfolio jumped 9.7% year-over-year. Take a deeper dive, and analyze individual credit unions, peer groups, states, and more. Learn what Peer-to-Peer can do for you.
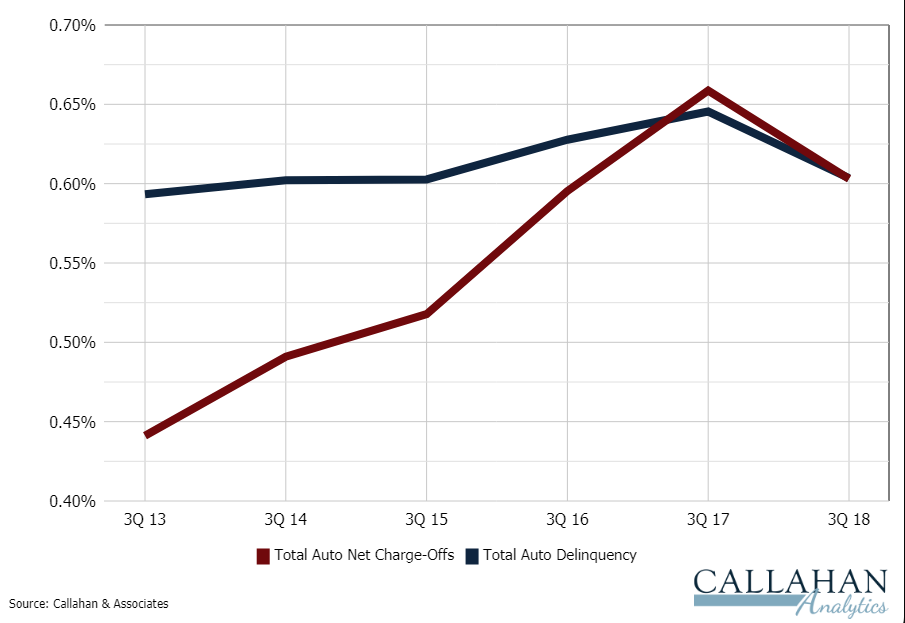
Auto loans are an attractive asset in a rising rate environment because their terms are typically shorter than mortgages. Shorter loan durations allow credit unions to reprice the portfolio faster and better manage interest rate risk. The delinquency and net charge-off rate for auto loans is poised to come in at 0.60%, which is 7 basis points lower than the third quarter average delinquency for the total loan portfolio.
AUTO DELINQUENCY AND NET CHARGE-OFFS
FOR U.S. CREDIT UNIONS | DATA AS OF 09.30.18

After peaking in 2017, net charge-off and delinquency in the auto portfolio is poised to drop to 0.60% in the third quarter of 2018.
Source: Callahan & Associates.
ContentMiddleAd

