In the year-end 2023 presentation of Trendwatch, Callahan & Associates analyzed how industry averages compared to median credit union performance. The largest credit unions account for a significant portion of the industry’s assets, and their performance can skew industry averages. Including data that reflects the median performance, however, allows interested parties to glean insights from a different angle.
NUMBER OF CREDIT UNIONS AND TOTAL ASSETS BY ASSET CLASS
FOR U.S. CREDIT UNIONS | DATA AS OF 12.31.23
© Callahan & Associates | CreditUnions.com
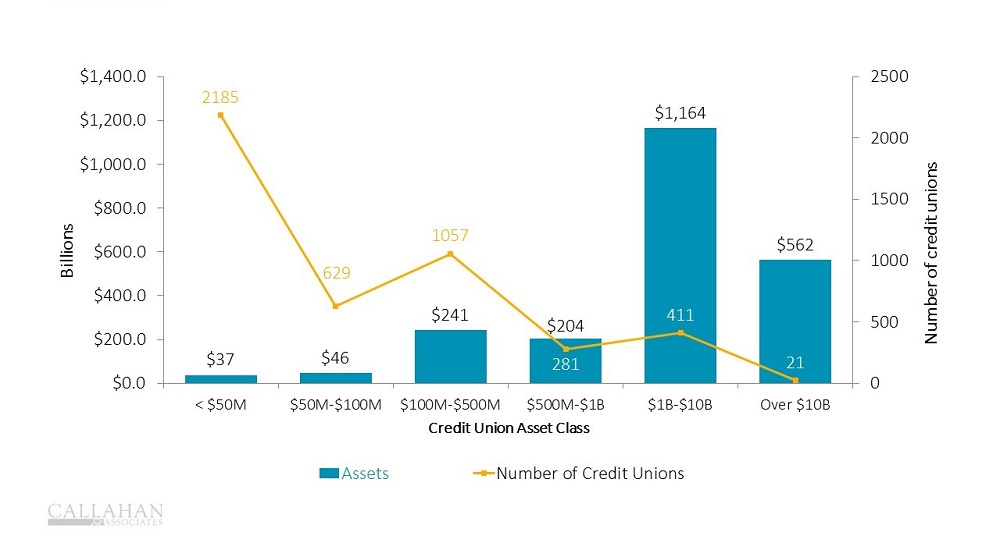
- Data articles written about the credit union industry typically consider total industry assets. For example, loan growth is usually represented as the change in loan balances for all 4,604 credit unions. Yet, 1.65% of credit unions hold 41.9% of assets, so a few institutions can pull metrics in a direction that doesn’t represent most credit unions. Considering only an industry average ignores how the majority of credit unions are performing, which is necessary context for proper analysis.
- On the other end of the size spectrum, 2,185 credit unions with less than $50 million in assets hold just $37 billion of the industry’s total assets. To better understand the performance of smaller institutions, it is important to consider median performance along with total industry performance. Understanding trends for both the median and the average is critical to ascertaining a complete picture across all 4,600 credit unions.
- For example, on average, share balances grew 1.7% year-over-year in 2023; however, the median credit union reported a 3.0% decline in shares. In fact, two-thirds of all credit unions reported negative share growth. Although it appears credit union share growth is depressed but still positive, average performance masks a broader outflow across the industry.
Are you using data to fuel strategic decisions?Callahan’s Peer Suite empowers credit union leaders to make informed, data-back decisions without wrestling with complex, manual processes. Benchmark against the peer groups your choose, automate your KPIs every quarter, and kickstart your journey to success. Request A Demo
LOAN-TO-SHARE RATIO
FOR U.S. CREDIT UNIONS | DATA AS OF 12.31.23
© Callahan & Associates | CreditUnions.com
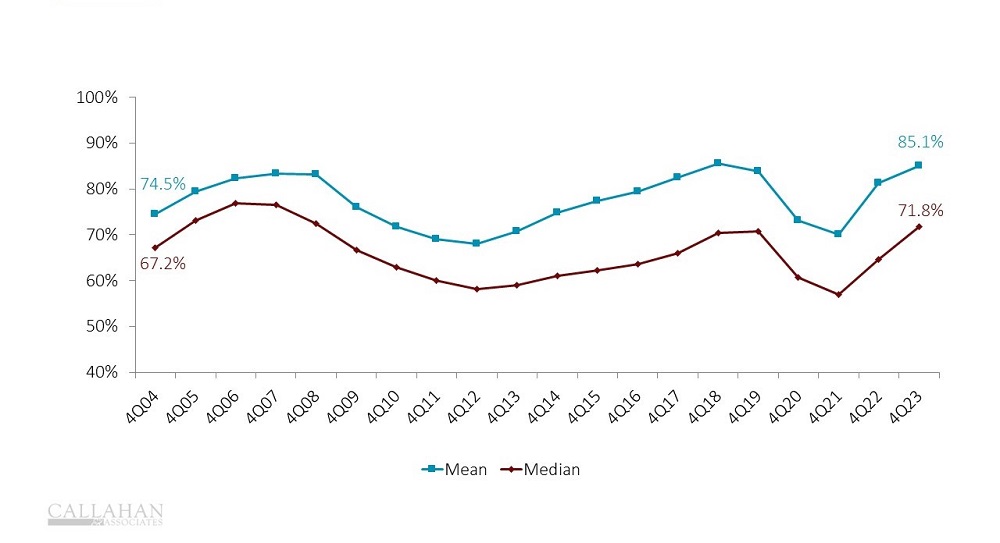
- Other trends further showcase how smaller credit unions might have different fundamentals from larger institutions. The loan-to-share ratio for the median credit union is 71.8%, well below the industry average of 85.1%. Because of their liquidity profile, that also means their cost of funds is smaller, with a median of 0.76% compared to the industry average of 1.59%.
- Building liquidity is a key focus for the credit union industry; however, it is primarily an issue for the largest credit unions. Although smaller credit unions have reported a broader outflow of shares, they aren’t as focused on attracting shares because they are in a better liquidity position — i.e., they have enough available funds to lend. In fact, in the fourth quarter of 2023, the median credit union reported nearly the same loan growth as the industry average. This shows smaller credit unions were able to keep growing loan balances despite the industry narrative of tightened liquidity.
Credit union performance data for this article comes from Callahan’s quarterly Trendwatch webinar, which includes Call Report data from 99% of all industry assets. Watch Trendwatch 2023 today on-demand.