The Federal Open Market Committee (FOMC) raised its benchmark interest rate four times in 2018. The last of these rate hikes occurred in the fourth quarter on Dec. 19, 2018.
With every rate hike, mortgages become more expensive, businesses are more reluctant to take out loans, and consumers look for deposit accounts with higher interest rates. In turn, credit unions are raising their own account rates accordingly, but they are finding it more difficult to attract new money in the current rate environment than in a low-interest rate one. What does an increase in the cost of funds mean for credit unions?
Click on the question to view the answer.
Question 1: (True/False) The average cost of funds at credit unions follows the trend of the federal funds rate.
True. A lower cost of funds allows credit unions to charge lower interest rates on loans because they are paying lower interest rates on deposits.
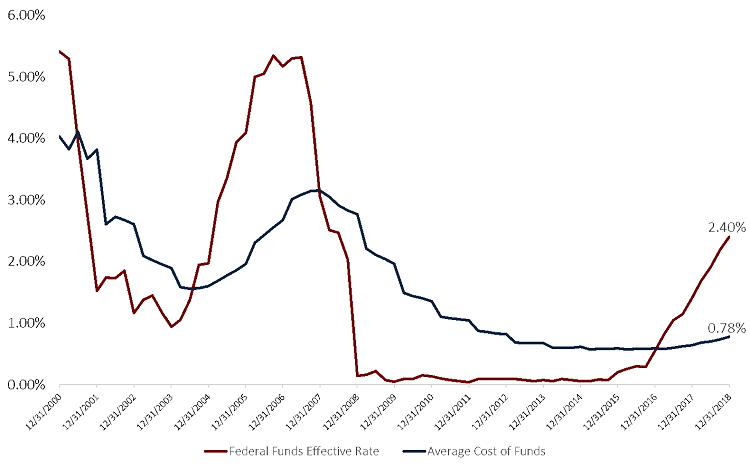
Analysts at Callahan & Associates predict the cost of funds reached 0.78% in the fourth quarter of 2018. That’s a 14-basis point increase year-over-year. During the same period, the effective federal funds rate rose 99 basis points from 1.41% at year-end 2017 to 2.40% at year-end 2018.
Although the two rates don’t align perfectly, there still exists a strong positive correlation of 0.68 between the effective federal funds rate and the credit union cost of funds. Expect to see a continued increase in the cost of funds because higher interest rates make it more expensive for financial institutions to acquire deposits.
AVERAGE COST OF FUNDS VERSUS EFFECTIVE FEDERAL FUNDS RATE
FOR U.S. CREDIT UNIONS | DATA AS OF 12.31.18

If rates continue to rise, credit unions can expect their cost of funds to gradually increase, too. However, the increase will likely lag a few quarters behind changes to the federal funds rate.
Source: FRED Economic Data
Question 2: (True/False) An increase in the cost of funds results in increased liquidity.
False. An increase in the cost of funds results in tighter liquidity.
In higher interest rate environments, depository institutions must raise rates on accounts to stay competitive. This makes it more expensive to bring in money through deposits.
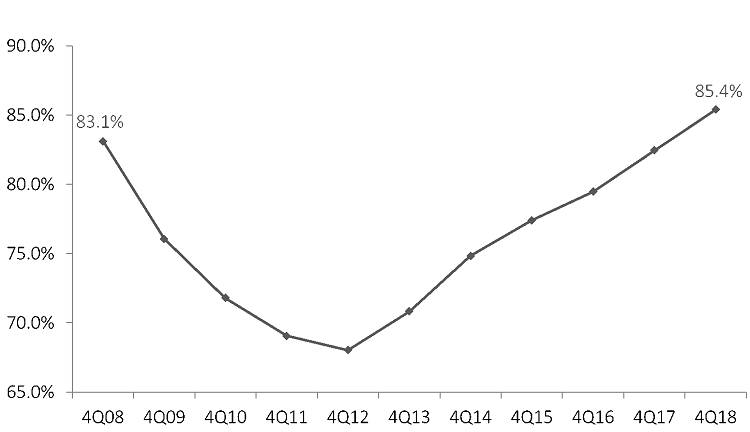
As savvy depositors look for institutions that offer the most competitive rates, share growth at credit unions has slowed from 6.0% in the fourth quarter of 2017 to 5.4% as of the fourth quarter of 2018. Loan growth, on the other hand, has increased 9.1% over the same period. With loan growth outpacing share growth, analysts at Callahan & Associates project the loan to share ratio reached a record high of 85.4% as of Dec. 31. As this ratio creeps higher, credit unions will need to find additional sources of liquidity in 2019 and beyond.
LOAN-TO-SHARE RATIO
FOR U.S. CREDIT UNIONS | DATA AS OF 12.31.18

Analysts at Callahan & Associates predict the credit union loan-to-share ratio reached 85.4% as of Dec. 31. This is the highest level ever recorded.
Source: Callahan & Associates.
Question 3: (True/False) In 2018, credit unions lent more than they took in via deposits.
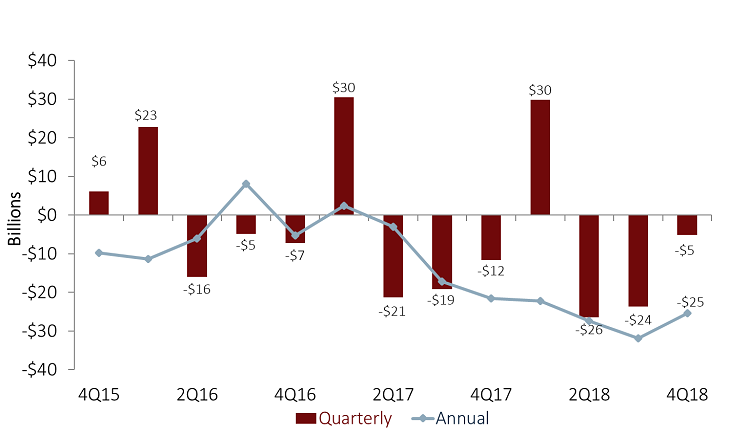
True. The net difference between annual deposit growth and annual loan growth is referred to as net liquidity change. As share growth slows relative to loan growth, the industry’s net liquidity position dips further negative.
On a quarterly basis, deposit inflows are typically largest in the first quarter, and credit unions typically have a positive net liquidity position. Deposit growth is smaller in quarters two through four see smaller deposit balance growth, pushing net liquidity negative. Callahan analysts project that from December 31, 2017 to December 31, 2018 the credit union industry lent out $25.5 billion more than it took in via deposit channels.
NET LIQUIDITY CHANGE
FOR U.S. CREDIT UNIONS | DATA AS OF 12.31.18

Credit unions lent $5.3 billion more than they took in over the past quarter.
Source: Callahan & Associates.
How Do You Compare?
Go beyond the national averages and dive deeper into individual credit unions, peer groups, state, and more using Peer-to-Peer. Let us walk you through your numbers with a custom performance audit.