Third Quarter 2016 Shares By The Numbers
Share balances in third quarter increased at the fastest rate since fourth quarter 2009, but the loan-to-share ratio still grew.
Share balances in third quarter increased at the fastest rate since fourth quarter 2009, but the loan-to-share ratio still grew.
The national average for each of these six mighty metrics is less than 10 percentage points, but even a change of a few basis points can make a big difference to a credit union.
Credit unions have ramped up marketing efforts and are reaping the benefits.
One asset-based peer group is 2.5 times more likely to convert core processors than other peer groups. Which one is it?
Core deposits have accounted for the bulk of share growth in 2016. Learn about past performance while waiting for third quarter numbers.
Total revenue for all credit unions topped $29 billion in the second half of 2016. Learn what happened with interest income, non-interest income, and ROA.
HMDA data reveals who is, and who isn’t, taking out mortgages.
Check out how the credit union loan portfolio fared in the first six months of 2016.
While home equity lines of credit and second mortgages account for a smaller portion of real estate loans, consumers are using them to a great extent.
Which 10 credit unions top the origination list in MortgageAnalyzer?

This year’s finalists are reimagining how credit unions use data to boost service levels and improve efficiencies.

In order to adopt a more proactive strategy, the Iowa cooperative is using a dedicated product development team to promote visibility and follow-through from idea to launch.

This year’s finalists are reimagining how credit unions can use AI to combine cutting-edge technology with old-school member service.

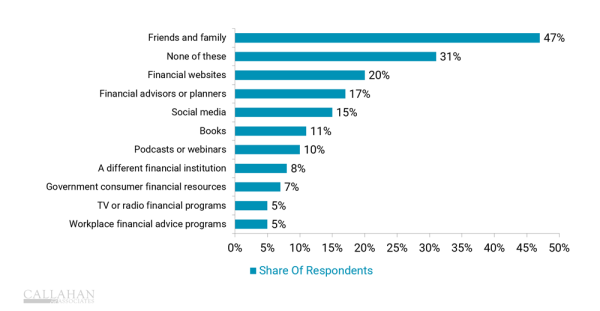
Financial advice comes in many forms. How can credits union make sure they are the No. 1 choice for their members?

This year’s finalists are uncovering new ways to harness the power of technology to improve and expand lending across the industry.

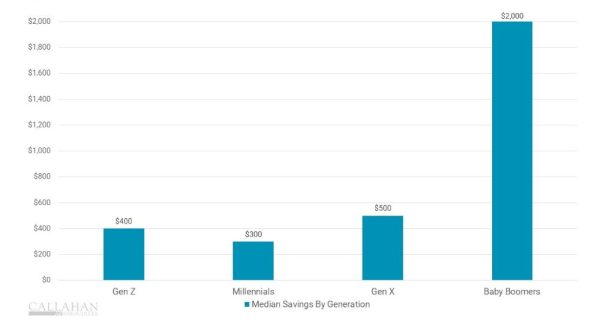
A program to help staffers improve their savings skills generated more than $200,000 in deposits and helped change participants’ financial habits.

As Super Bowl LX nears, the Callahan Bowl prediction model says the Seahawks will see green en route to the Lombardi Trophy.

Lending is evolving, and credit unions are adapting. This week, CreditUnions.com examines how shifting economic conditions are reshaping lending strategies.

Affordability pressures, extended loan terms, and shifting vehicle values are forcing institutions to look beyond familiar structures and reconsider how to balance risk and return.

Credit unions are uniquely well-positioned to guide members through uncertainty and fill essential funding gaps.