
Hover over image to enlarge
LENDING
Growing borrower confidence underpins impressive gains in the consumer portfolio.
Consumer products such as auto loans, student loans, and credit cards were the core driver of credit union lending through the first nine months of 2014. In total, consumer loans at credit unions increased 13.7% or $19.9 billion year-to-date over 2013.
19.9M
The number of loans made to members in the first nine months of 2014, up from 18.7 million in the first nine months of 2013.
10.1%
The total outstanding annual loan growth at credit unions as of September, compared to a growth rate of 6.8% back in September 2013.
Balances in every loan category increased at the same pace or faster in the first nine months of this year compared to 2013. The most substantial increase, 19.4%, occurred in the new auto loan portfolio. Loan balances in the used auto and member business loan portfolios also increased by double digits over the same period by 12.2% and 14.0%, respectively.
Economic indicators suggest the economy is strengthening; likewise, members have been spending more and saving less. This shift in consumer confidence has contributed to year-over-year loan growth of 10.1%, surpassing the solid 6.8% credit unions posted in September 2013 and outpacing share growth nearly threefold.

Hover over image to enlarge
AUTO LENDING
This market segment has put the pedal to the metal in 2014, especially for new vehicles.
Outstanding auto loan balances at credit unions topped $224.7 billion as of September. The year-over-year growth in both new and used loans 19.4% and 12.2%, respectively contributed to an overall annual growth in the auto portfolio of 14.7%. Additionally, the growth rate for new auto loans was the fastest of any loan type in the credit union portfolio.
Indirect lending (auto and other) has played a key role in the credit union auto portfolio. Indirect balances reached $109 billion in third quarter 2014, and the channel’s 21.7% annual growth is over two times as fast as the 8.9% growth for direct auto loans. Indirect loans comprised 49% of the total auto portfolio in third quarter; that’s up from 43.9% in 2009.
Additionally, credit unions captured 16.0% of auto loan originations through the first nine months of 2014 compared to 14.7% over the same time last year. This uptick was especially prominent between May and September, when credit unions recorded 16.0% or stronger market share during each month.
Auto Loan Net-Charge Offs: 0.46%
Credit unions’ annualized net charge-off rate as of September 2014, up slightly from 42 basis points in September 2013.
Source: Callahan Associates
Auto Market Share
2013: 14.7% vs. 2014: 16.0%
The industry’s market share for auto loan originations is up 1.3 percentage points from the first nine months of 2013.
Source: Autocount Data From Experian Automotive; Callahan Associates


Hover over image to enlarge
MORTGAGE LENDING
Preparing for a market shift to purchases is paying off for credit unions.
The decrease in refinancing activity took a toll on credit union mortgage lending. Credit unions generated $68.1 billion in mortgage originations through September 2014; that’s down 29.8% from the $97.0 billion lent in the first nine months of 2013.
However, credit unions are originating more adjustable rate and hybrid mortgages. These options now comprise approximately 37.4% of total first mortgage originations compared to as little as 17.8% in 2012. These loans’ lower rates entice members, especially those who plan to move before the end of their loan term, and their periodic rate adjustments help credit unions mitigate interest rate risk.
Such options are also helping credit unions increase their mortgage market share. The cooperative financial industry accounted for 8.1% of the $844 billion in total mortgage originations in the United States through the first nine months of 2014, according to the Mortgage Bankers Association. That’s a marked improvement from the 6.6% posted in 2013 and nearly double the 4.8% posted in September 2010.
And because many credit unions now hold more of the mortgages they make on their balance sheets, outstanding first mortgage loans increased 9.2% annually to $290.7 billion. This, again, is notably stronger than the 7.7% growth posted one year ago.

Hover over image to enlarge
CREDIT CARDS
More members are demanding cards. Better yet, they are prudently using credit.
The rising demand of credit cards coupled with their attractive yields resulted in many credit unions prioritizing this arm of their business in 2014. A handful of credit unions even took the reigns of their own portfolios for the first time.
More than 57% of the industry offered credit cards as of third quarter 2014. That’s up four percentage points from one year ago. Outstanding balances hit $44.5 billion, which is an 8.3% increase over third quarter 2013 and is the largest annual uptick in credit card balances since 2007. At $2,733, the average credit card balance as of September 2014 was also slightly higher than it was one year ago.
What’s more, the number of active cards in circulation reached an all-time high of 16.3 million this quarter, with more than 1.1 million new cards added since third quarter 2013.
Credit card penetration, which measures the segment of members who carry a balance on a credit union credit card, was 16.3% as of September. That’s a 67-basis-point increase from one year ago and an increase of more than two percentage points from five years ago.
Credit union members are setting a good example for the nation by managing these financial tools more judiciously, as indicated by the 12-basis-point drop in net charge-offs since September 2013.
16.3M
The total number of credit card accounts at credit unions reached 16.3 million as of September 2014, an annual increase of 7.4%.
Credit Card Penetration
2013: 15.6% vs. 2014: 16.3%
An increasing number of members are using credit union credit cards, pushing up the penetration rate for this product to 16.3% as of September 2014.

Hover over image to enlarge
SHARES
Members are opening new accounts; however, consumer focus on savings has slowed.
2.8M
The increase in the number of share draft accounts at credit unions between September 2013 and September 2014.

Hover over image to enlarge
MEMBER BUSINESS LOANS
New expertise and a better understanding of business lending have helped credit unions make gains in this part of the portfolio.
213,000
The number of member business loans granted to members in the first nine months of 2014.

Hover over image to enlarge
INVESTMENTS
ROI is growing, but credit unions are investing less because of strong loan growth.
Total investment and cash balances as of September 2014 declined to $369.0 billion from $385.3 billion in 2013. This follows the seasonal pattern of lower balances in the second and third quarter; however, accelerating lending activity has contributed to the reduction in investment balances.
Despite the 4.2% reduction in the investment and cash portfolio, credit unions are earning a higher return on their investment this year. In fact, the average yield grew by 12 basis points to reach 1.24% in the third quarter of 2014, driven primarily by larger investments in higher-yielding securities and lower cash balances.
Federal agency securities continue to make up the largest portion of the industry’s investment portfolio, representing 51.5% of total activity. Meanwhile, cash at corporate credit unions and other financial institutions has declined over the past year.
MEMBER RELATIONSHIPS
Members are showing they understand the give-and-take inherent in the cooperative model by deepening their ties with credit unions.
Double-digit loan growth, excluding member business loans, and share growth outpaced the 2.9% membership growth rate credit unions have posted so far in 2014. As such, the industry’s average member relationship increased 3.1% annually to reach $16, 102 as of third quarter 2014.
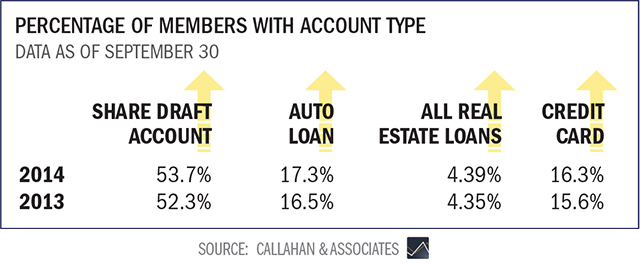
Credit unions also posted an annual increase in penetration rates for all major products including share draft accounts, auto loans, real estate loans, and credit cards over the same time frame. Credit unions posted the largest percentage point growth in share draft penetration. More than half, 53.7%, of members held a credit union checking account as of September 2014. That’s up 1.4 percentage points from 12 months ago. Both auto penetration and credit card penetration also increased nearly one percentage point from 2013.

Hover over image to enlarge
EARNINGS
Credit unions are playing to core strengths and stretching every dollar earned.
Growth in loan and investment income has contributed to a 2.4% year-over-year increase in total revenue. This is one of two times since second quarter 2009 in which that has occurred. Through the first nine months of 2014, total revenue stood at $38.5 billion.
In addition, a 4.2% annual increase in total interest income during the first nine months of the year helped offset a 1.9% decline in total non-interest income.
Loan income itself grew by 3.8% annually, reaching a total of $24.4 billion in third quarter 2014. As a result, the net interest margin also expanded by five basis points year-over-year, the third consecutive quarter in which an uptick has occurred.
Thanks in part to higher interest rates, investment income climbed to $3.4 billion through September 2014, at an annual growth rate of 7.6%. Meanwhile, total non-interest income fell compared to a year prior, with fee and other operating income down 2.9% and 0.9%, respectively.
Viewed as a percentage of average assets, fee income declined by five basis points and other operating income dropped three basis points, though the drop in the latter was likely influenced by reduced mortgage sales to the secondary market. During the first nine months of 2014, credit unions sold $22.2 billion in first mortgages to the secondary market, which is a 52.4% decrease from one year ago.
Still, credit unions have deftly managed their expenses. The operating expense ratio fell six basis points annually to 3.10%. As of third quarter 2014, the industry’s return on assets was 0.83%, three basis points higher than third quarter 2013.
-1.9%
Non-Interest Income Growth
4.2%
Interest Income Growth
2.4%
Growth In Total Revenue
Hover over image to enlarge
STUDENT LENDING
Cooperative loans help approximately 474,000 students and their families pay for higher education.
The rising costs of higher education have caused many students to seek the assistance of private loans, and they are looking to their credit union as an alternative to higher-cost options such as credit cards or home equity lines of credit.
In the past three years, outstanding balances in this segment of the portfolio have more than doubled, increasing from $1.3 billion in September 2011 to almost $3.1 billion in September 2014.
This uptick has been made possible in part through the efforts of multiple credit union service organizations (CUSOs), such as Credit Union Student Choice and CU Student Lending, that facilitate this activity on a larger scale and make these loans more efficient, profitable, and safe for the issuing institutions.
For example, student loan delinquency at credit unions was 1.42% in September 2014 versus 10.9% the month prior for all federal and private student loans, according to the Federal Reserve Bank of New York. The net charge-off rate for student loans provided by credit unions is also low, averaging only 23 basis points as of third quarter 2014.
$6,511
The average balance of a credit union student loan in 3Q 2014.
10.9% vs. 1.42%
The delinquency rate for student loans outstanding from all sources in 3Q 2014 compared to those issued by credit unions specifically.