Read the full analysis or skip to the section you want to read by clicking on the links below.
| LENDING | AUTO LENDING | AUTO MARKET SHARE MAP |
| MORTGAGE LENDING | CREDIT CARDS | SHARES |
| MEMBER BUSINESS LENDING | INVESTMENTS | MEMBER RELATIONSHIPS |
| EARNINGS | SPECIAL SECTION: FINANCIAL WELLNESS |
Lending
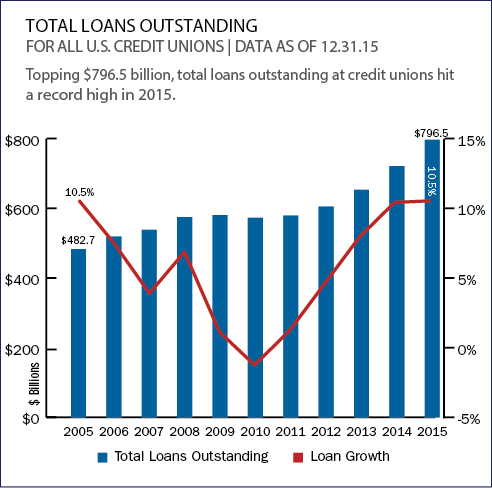
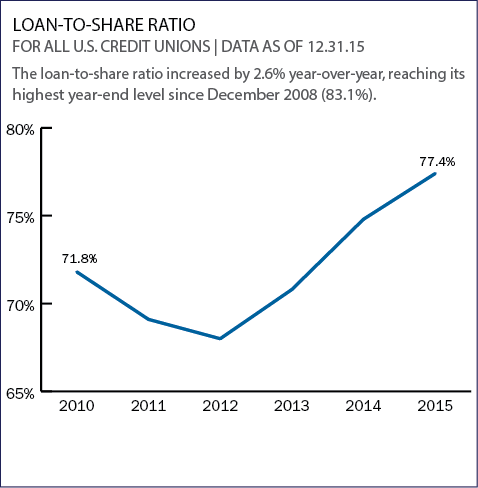
Credit union lending expanded 10.5% annually, reaching a record high of $796.5 billion in 2015. The industry posted year-over-year growth in every major loan category, including a 16.0% annual increase in new auto loans and a 12.8% annual increase for used auto loans. Loan originations totaled $410.6 billion at year-end 2015, representing a 15.9% annual increase. Credit unions lent an average $1.1 billion every day and made more than 28 million new loans during the year. Loan growth outpaced deposit growth by 3.7 percentage points, which pushed the loan-to-share ratio up 2.6 percentage points to 77.4%.
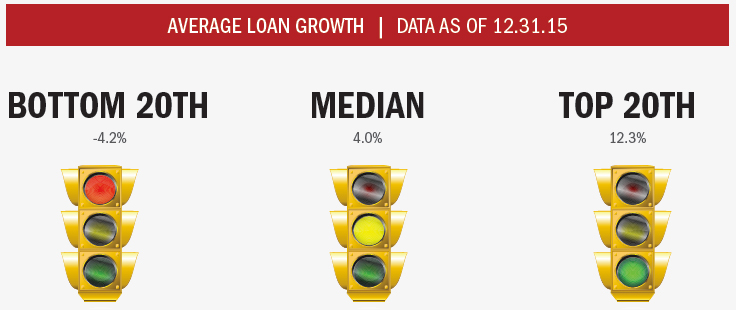
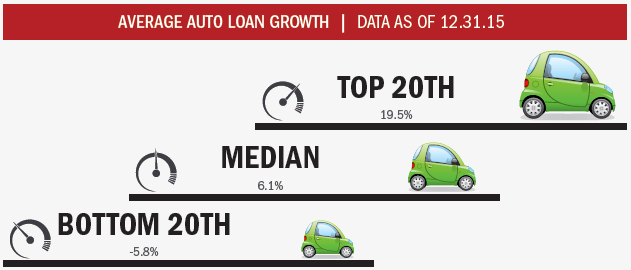
The median credit union loan portfolio expanded 4.0% year-over-year. Performers in the top 20th percentile posted 12.3% growth while those in the bottom 20th percentile reported their loan portfolios shrunk 4.2% over the period.
Source for all graphs, rankings, and maps unless otherwise noted: Peer-to-Peer Analytics by Callahan Associates.
| LENDING | AUTO LENDING | AUTO MARKET SHARE MAP |
| MORTGAGE LENDING | CREDIT CARDS | SHARES |
| MEMBER BUSINESS LENDING | INVESTMENTS | MEMBER RELATIONSHIPS |
| EARNINGS | SPECIAL SECTION: FINANCIAL WELLNESS |
Auto Lending
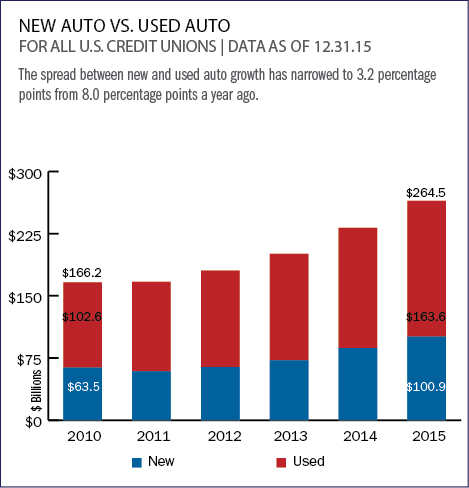
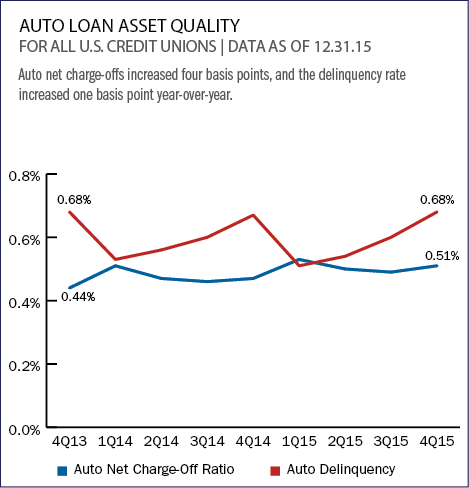
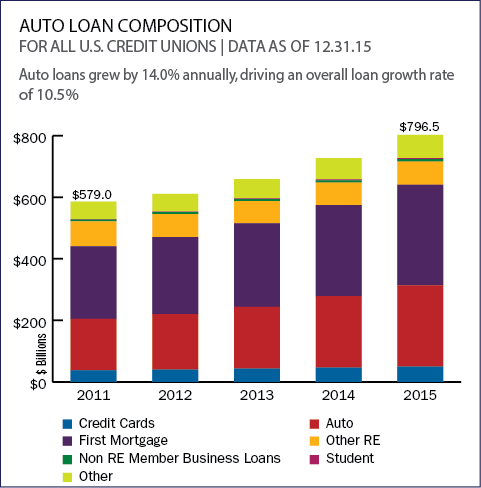
Credit unions increased their market share for auto loan originations by 20 basis points annually, reaching 16.5% as of December 2015. The industry’s total auto loan portfolio has expanded 14.0% over the past 12 months with balances reaching $264.5 billion. Put another way, more than 19 million members hold an auto loan originated by a credit union. New and used auto loans expanded 16.0% and 12.7%, respectively, year-over-year. Indirect lending outpaced direct lending and comprised 51.9% of total auto loans at year-end. Indirect lending activity increased 20.5% annually, with balances hitting $137.3 billion. Direct lending increased 7.6%, with balances hitting $127.3 billion.
Credit unions reported median year-over-year auto loan growth of 6.1% as of December 2015, up from 5.2% the previous year.
Source for all graphs, rankings, and maps unless otherwise noted: Peer-to-Peer Analytics by Callahan Associates.
| LENDING | AUTO LENDING | AUTO MARKET SHARE MAP |
| MORTGAGE LENDING | CREDIT CARDS | SHARES |
| MEMBER BUSINESS LENDING | INVESTMENTS | MEMBER RELATIONSHIPS |
| EARNINGS | SPECIAL SECTION: FINANCIAL WELLNESS |
Auto Market Share Map

Source for all graphs, rankings, and maps unless otherwise noted: Peer-to-Peer Analytics by Callahan Associates.
| LENDING | AUTO LENDING | AUTO MARKET SHARE MAP |
| MORTGAGE LENDING | CREDIT CARDS | SHARES |
| MEMBER BUSINESS LENDING | INVESTMENTS | MEMBER RELATIONSHIPS |
| EARNINGS | SPECIAL SECTION: FINANCIAL WELLNESS |
Mortgage Lending
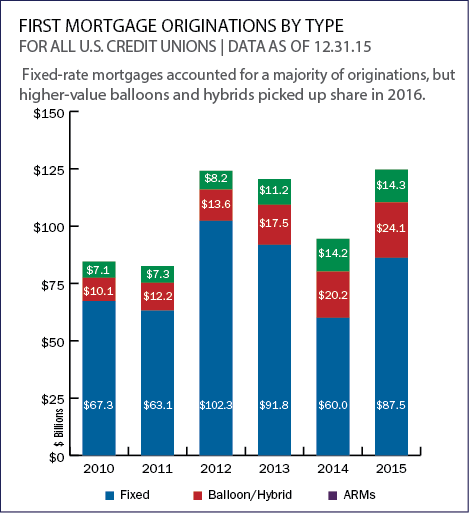
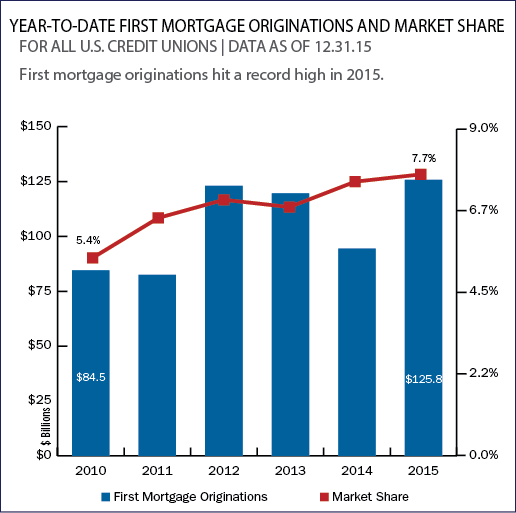
Credit unions originated $125.8 billion in first mortgages in 2015; that’s the highest annual amount in the industry’s history. All told, credit unions helped put more than 660,000 members in homes over the past 12 months. Along with originations, outstanding first mortgage balances also expanded 10.3% from December 2014 to 2015. Among first mortgage originations, the proportion of fixed rate products rose from 63.6% to 69.5% year-over-year. Despite gains in originations, asset quality was not dampened. In fact, reportable first mortgage delinquency at year-end was 16-basis points lower than in December 2014; the largest drop of any loan product. Net charge-offs declined five basis points over the same period.
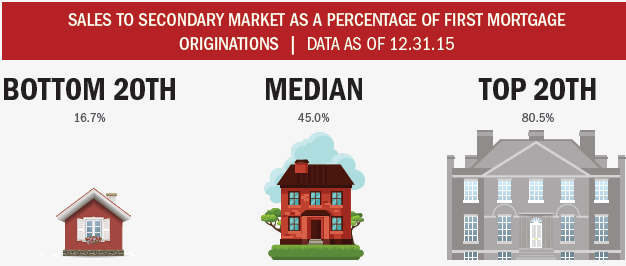
Credit unions in the bottom 20th percentile sold on average 16.7% of their first mortgage loans to the secondary market while top-selling credit unions in the upper 20th percentile sold 80.5% on average. The industry median for sales to the secondary market as a percentage of total first mortgage originations was 45.0%.
Source for all graphs, rankings, and maps unless otherwise noted: Peer-to-Peer Analytics by Callahan Associates.
| LENDING | AUTO LENDING | AUTO MARKET SHARE MAP |
| MORTGAGE LENDING | CREDIT CARDS | SHARES |
| MEMBER BUSINESS LENDING | INVESTMENTS | MEMBER RELATIONSHIPS |
| EARNINGS | SPECIAL SECTION: FINANCIAL WELLNESS |
Credit Cards
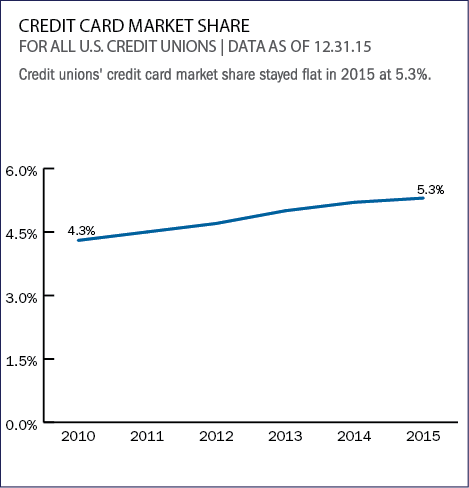
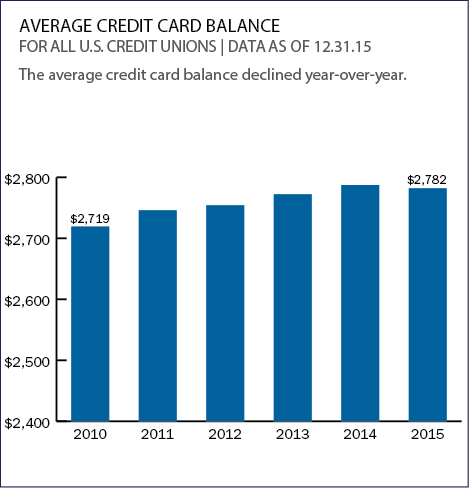
Improving economic conditions and consumer confidence underpinned a continued demand for credit cards throughout 2015. Accordingly, the number of credit unions that offer credit cards increased to 58.8% and total credit card loan balances topped $49.3 billion at year-end. In total, the industry has expanded its portfolio by more than $2.8 billion or 6.1% over the past 12 months. Additionally, the number of active cards in circulation reached an all-time high of 17.7 million in fourth quarter 2015, with nearly 1.1 million new cards added since December 2014.
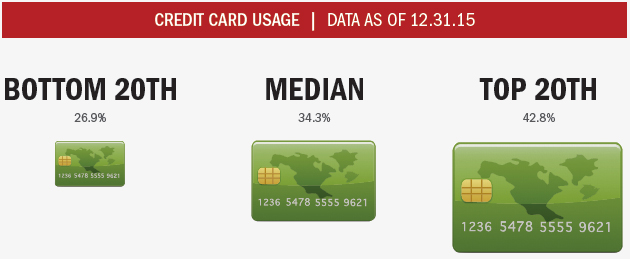
For all three percentile rankings (bottom 20th, median, and top 20th), credit card utilization rates declined slightly from the previous year-end levels.
Source for all graphs, rankings, and maps unless otherwise noted: Peer-to-Peer Analytics by Callahan Associates.
| LENDING | AUTO LENDING | AUTO MARKET SHARE MAP |
| MORTGAGE LENDING | CREDIT CARDS | SHARES |
| MEMBER BUSINESS LENDING | INVESTMENTS | MEMBER RELATIONSHIPS |
| EARNINGS | SPECIAL SECTION: FINANCIAL WELLNESS |
Shares
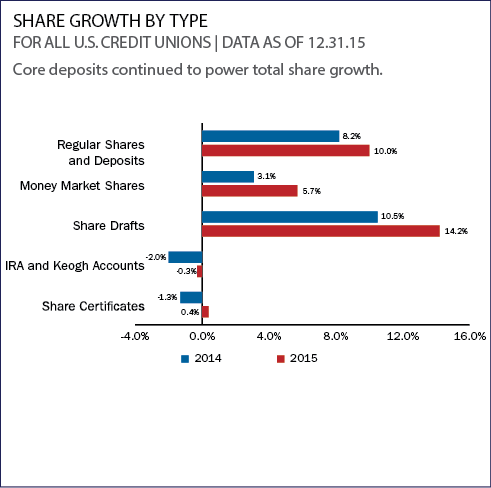
Credit unions posted a 6.8% increase in share balances in 2015. Regular shares long considered a safe haven for member money accounted for the majority of that growth, with total balances increasing $33.8 billion. Average share draft balances increased $205 to $2,662 as the number of share draft accounts reached a new high of 57.3 million a positive sign for a product that indicates members are using the credit union as their primary financial institution. Collectively, core deposits which include regular shares, share drafts, and money market shares increased 9.3% to $743.9 billion, fueling the industry’s overall annual share growth.
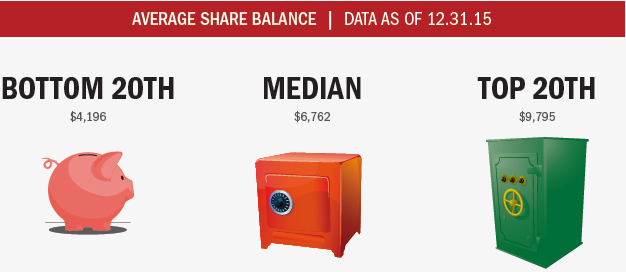
Industrywide, average share balances increased 3.1% year-over-year. Credit unions in the top 20th percentile reported an average share balance of $9,795, while those in the middle 50th and bottom 20th percentiles reported $6,762 and $4,196, respectively.
Source for all graphs, rankings, and maps unless otherwise noted: Peer-to-Peer Analytics by Callahan Associates.
| LENDING | AUTO LENDING | AUTO MARKET SHARE MAP |
| MORTGAGE LENDING | CREDIT CARDS | SHARES |
| MEMBER BUSINESS LENDING | INVESTMENTS | MEMBER RELATIONSHIPS |
| EARNINGS | SPECIAL SECTION: FINANCIAL WELLNESS |
Member Business Lending
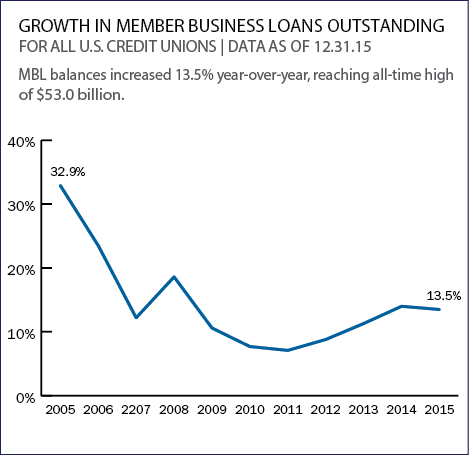
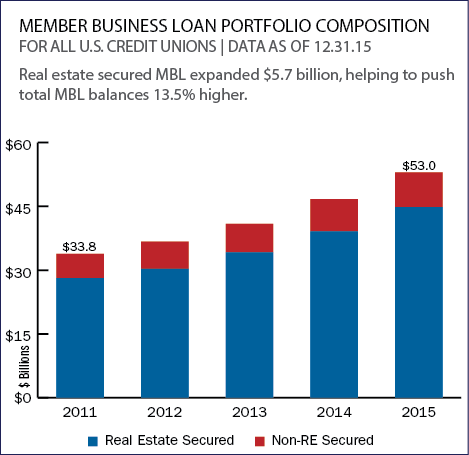
Member business loans represent just 4.3% of the industry’s assets, but they are an increasingly important component of the credit union loan portfolio. Outstanding member business loans increased 13.5% from December 2014 to December 2015, topping $53.0 billion at year-end. The industry stepped into 2016 ready to lend, with more than 2,100 institutions or one in three credit unions holding member business loans in their portfolio. By comparison, roughly 1,800 credit unions or 20.5% of the total industry participated in member business lending a decade ago.
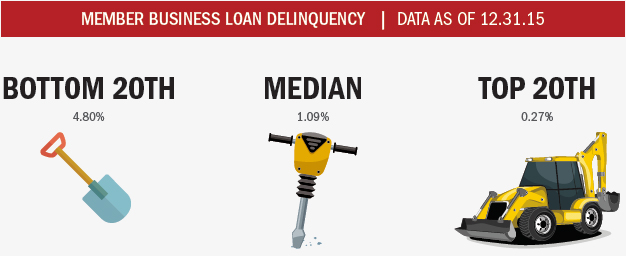
The median MBL delinquency for the industry was 1.09% as of December 2015, over 3 percentage points lower than credit unions in the bottom 20th percentile who reported delinquency of 4.80%, but greater than the top 20th percentile, where credit unions posted an MBL delinquency rate of 0.27%.
Source for all graphs, rankings, and maps unless otherwise noted: Peer-to-Peer Analytics by Callahan Associates.
| LENDING | AUTO LENDING | AUTO MARKET SHARE MAP |
| MORTGAGE LENDING | CREDIT CARDS | SHARES |
| MEMBER BUSINESS LENDING | INVESTMENTS | MEMBER RELATIONSHIPS |
| EARNINGS | SPECIAL SECTION: FINANCIAL WELLNESS |
Investments
Credit unions held $350 billion in investments as of Dec. 31, 2015; that’s a slight increase from the third quarter. Credit unions made few new investments in the fourth quarter because most were waiting for the Fed to raise short-term rates at the December meeting. The average yield on investments 1.24% was unchanged at the end of the fourth quarter. This makes sense given the composition of the overall portfolio was relatively unchanged during the quarter. Going forward, expect this to increase as the full effect of the 25-basis-point increase to 50 basis points in the interest rate on excess reserves should increase the overall yield of the portfolio.
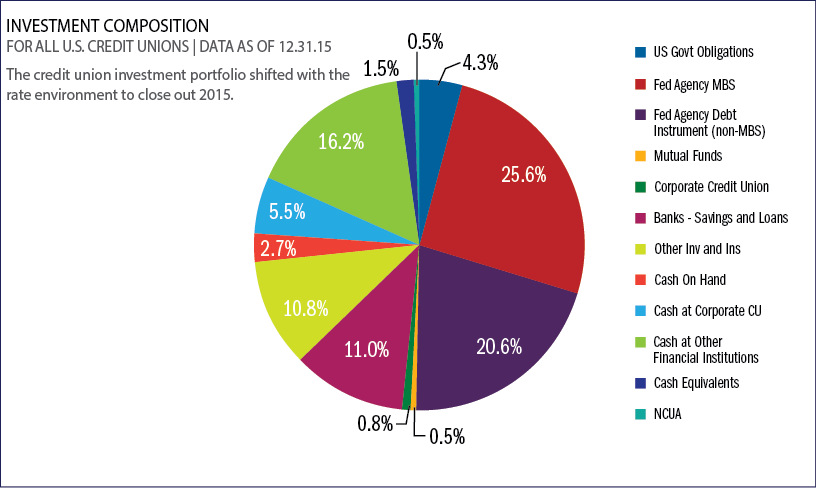

The median yield on average investments stands at 0.97%, up from 0.91% a year ago. Credit unions ranked in the top 20th percentile report an investment yield of 1.35% while those in the bottom 20th report just a 0.57% yield.
Source for all graphs, rankings, and maps unless otherwise noted: Peer-to-Peer Analytics by Callahan Associates.
| LENDING | AUTO LENDING | AUTO MARKET SHARE MAP |
| MORTGAGE LENDING | CREDIT CARDS | SHARES |
| MEMBER BUSINESS LENDING | INVESTMENTS | MEMBER RELATIONSHIPS |
| EARNINGS | SPECIAL SECTION: FINANCIAL WELLNESS |
Member Relationships
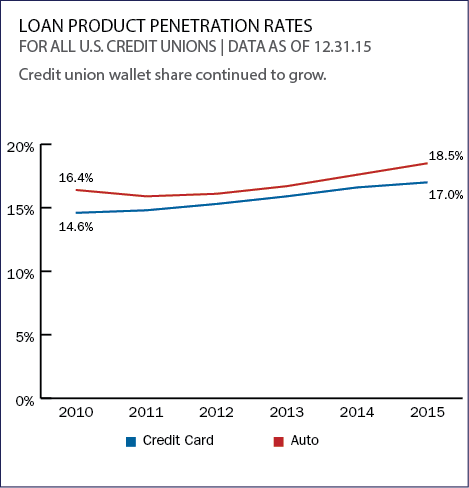
Share draft penetration, which measures the percentage of members who use a credit union for their day-to-day financial transactions, increased 1.2 percentage points annually to 55.1% as of December 2015. This represents the highest share draft penetration ever recorded. As for loan products, members are increasingly using their credit union for their credit needs, too. Both credit card and auto penetration rates increased in 2015, rising 0.5% and 0.9%, respectively.
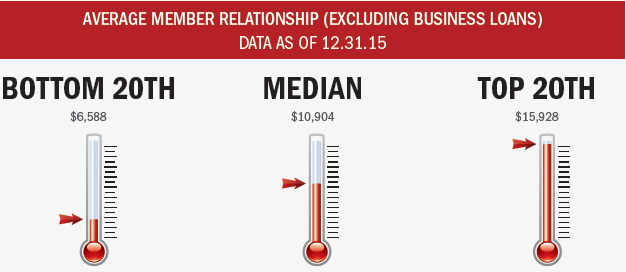
Members are increasingly choosing credit unions as their primary financial institution. Between December 2014 and December 2015, the average member relationship increased $738.
Source for all graphs, rankings, and maps unless otherwise noted: Peer-to-Peer Analytics by Callahan Associates.
| LENDING | AUTO LENDING | AUTO MARKET SHARE MAP |
| MORTGAGE LENDING | CREDIT CARDS | SHARES |
| MEMBER BUSINESS LENDING | INVESTMENTS | MEMBER RELATIONSHIPS |
| EARNINGS | SPECIAL SECTION: FINANCIAL WELLNESS |
Earnings
Credit unions posted a 7.1% year-over-year increase in loan interest income at year-end 2015 and a 6.1% increase in total interest income. However, investment income declined 0.9%. Income from mortgage sales on the secondary market underpinned an 12.1% increase in other operating income, which, in turn, helped non-interest income expand 7.4% to $16.0 billion. The net interest margin also posted a slight annual improvement, rising one basis point from December 2014 to 2.86% as of December 2015. However, the fact this remains lower than the operating expense to average assets ratio of 3.12% indicates credit unions need non-interest income.
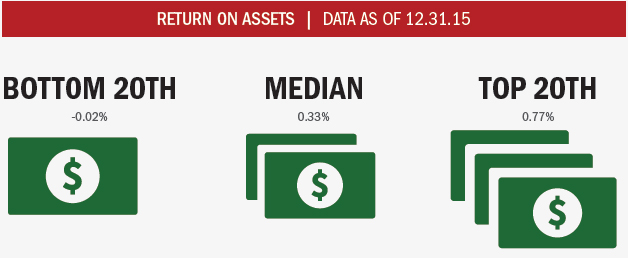
ROA fell 5 basis points year-over-year as asset growth outpaced net income growth. The industry median in December 2015 was 0.33%. Credit unions ranking in the bottom 20th percentile reported an averge ROA of -0.02% while those in the top 20th percentile reported 0.77% ROA.
Source for all graphs, rankings, and maps unless otherwise noted: Peer-to-Peer Analytics by Callahan Associates.
| LENDING | AUTO LENDING | AUTO MARKET SHARE MAP |
| MORTGAGE LENDING | CREDIT CARDS | SHARES |
| MEMBER BUSINESS LENDING | INVESTMENTS | MEMBER RELATIONSHIPS |
| EARNINGS | SPECIAL SECTION: FINANCIAL WELLNESS |
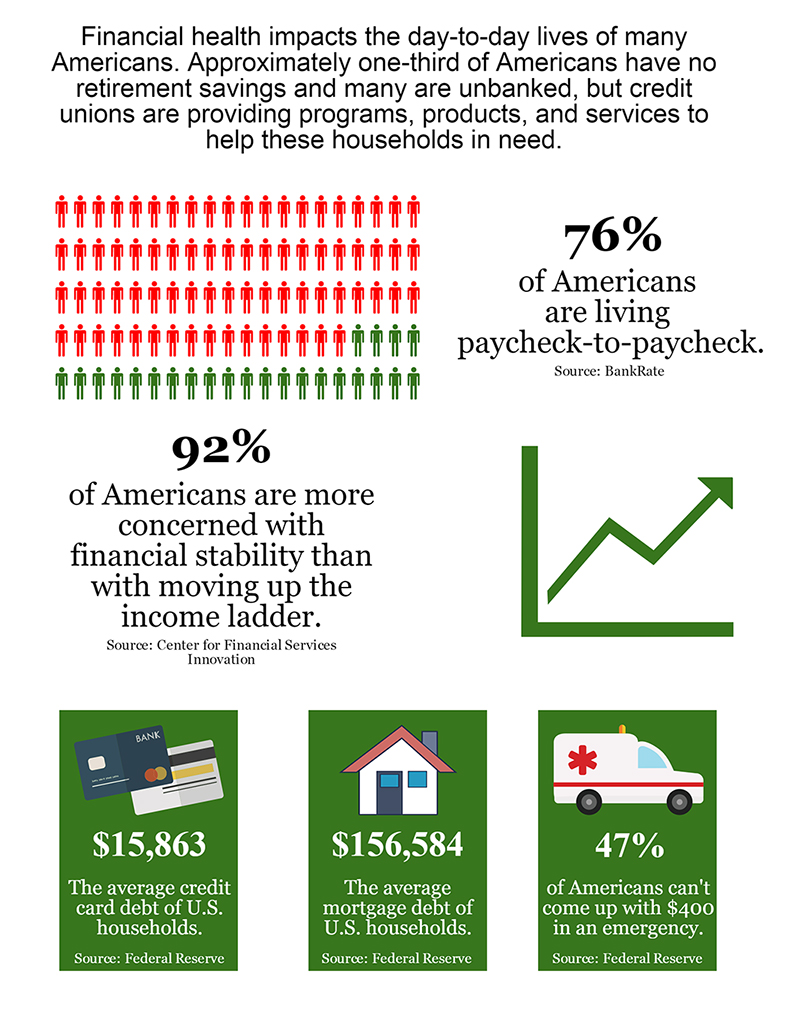
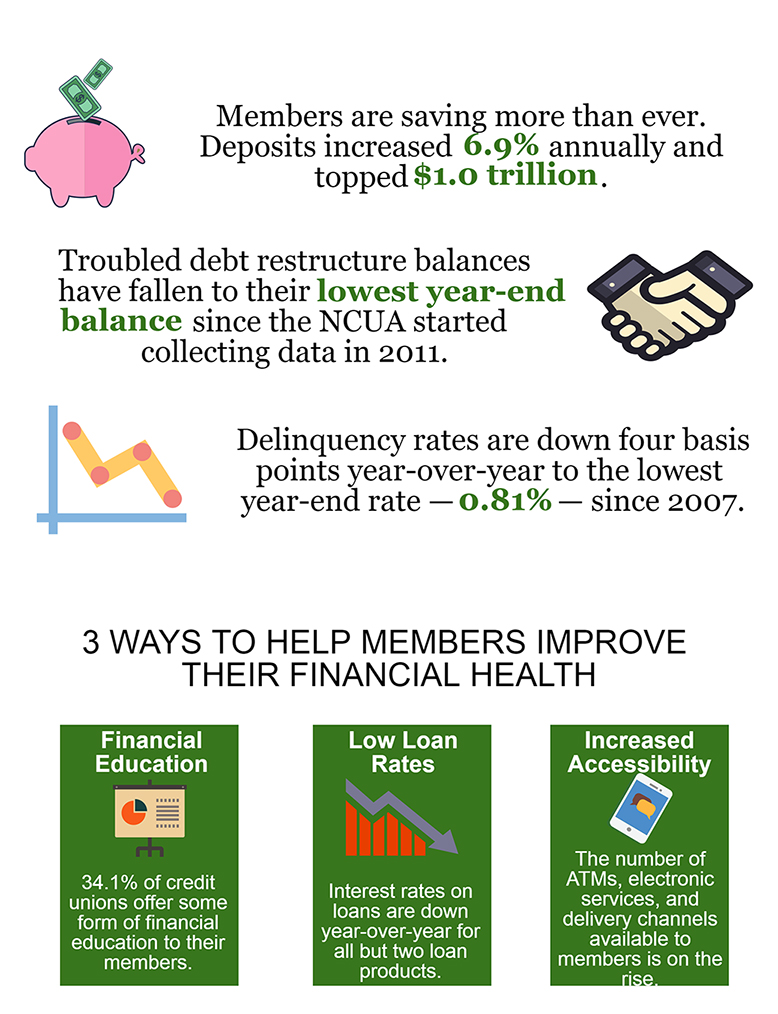
Special Section: Financial Wellness
Source for all graphs, rankings, and maps unless otherwise noted: Peer-to-Peer Analytics by Callahan Associates.