The average bank in the United States holds $5.2 billion in assets, compared with $503.0 million for the average credit union. With such great scale, banks have the efficiency and flexibility to reach more customers; they also have opportunities to diversify revenue streams in ways that credit unions cannot, often leading to greater net income generation.
However, credit unions do have a powerful advantage over banks: their mission of helping people over profit.
In difficult economic times, it is especially important for credit unions to deliver this message to those who need to hear it. In good times, most Americans see banks and credit unions as synonymous providers of financial services. It is in times of struggle that credit unions truly earn their charter.
EARNINGS MODEL: CREDIT UNIONS VERSUS BANKS
FOR U.S. CREDIT UNIONS AND BANKS | YTD THROUGH 06.30.2024, ANNUALIZED
© Callahan & Associates | CreditUnions.com
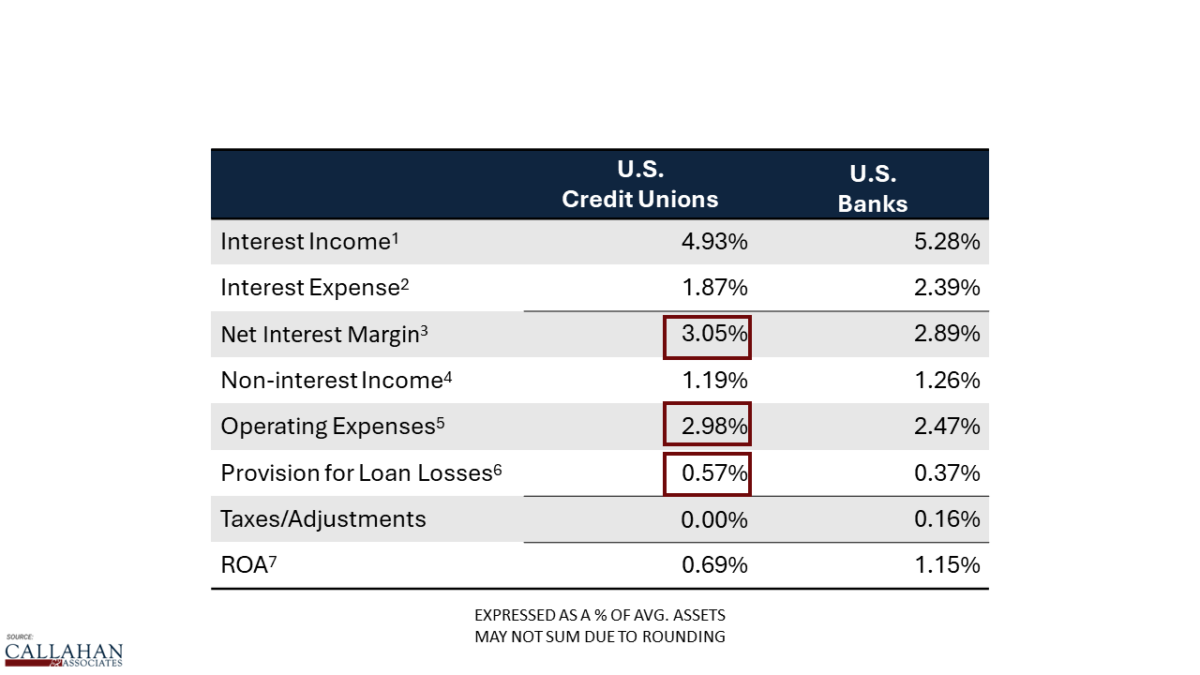
As a percent of assets, the interest income of credit unions is 35 basis points lower than their banking counterparts — 4.93% versus 5.28%, respectively. With their cooperative structure and members-first mission, credit unions often offer lower interest rates. On the other side of the business model, banks are allowed to invest in riskier securities than most credit unions, which can have an impact (good and bad) on interest revenue.
What might be surprising is that credit unions report a lower interest expense than banks, implying a lower dividend rate for savers. This is often related to liquidity needs and margin pressures. Banks borrow more than credit unions do, which usually leads to higher interest expenses in ways that don’t directly benefit the customer. Still, for margin management in a competitive deposit environment, many credit unions are clearly focusing on controlling interest expenses.
Combining the two points above, the credit union net interest margin at midyear was 3.05%, 16 basis points higher than banks, with the difference coming from savings on the expense side.
Credit unions typically earn less in non-interest income compared to banks. Banks tend to be far more diversified in their revenue streams and have more lenient regulation around certain investing strategies and supplemental business models. Fees, also, are important here. Credit unions rely more on NSF/OD fees than banks on a per dollar basis. However, credit union balance sheets are largely dominated by personal accounts, whereas banks are predominantly funded by large corporations that are less likely to run up frequent transactional fees.
EARNINGS MODEL: CREDIT UNIONS VERSUS BANKS
FOR U.S. CREDIT UNIONS AND BANKS | YTD THROUGH 06.30.2024, ANNUALIZED
© Callahan & Associates | CreditUnions.com
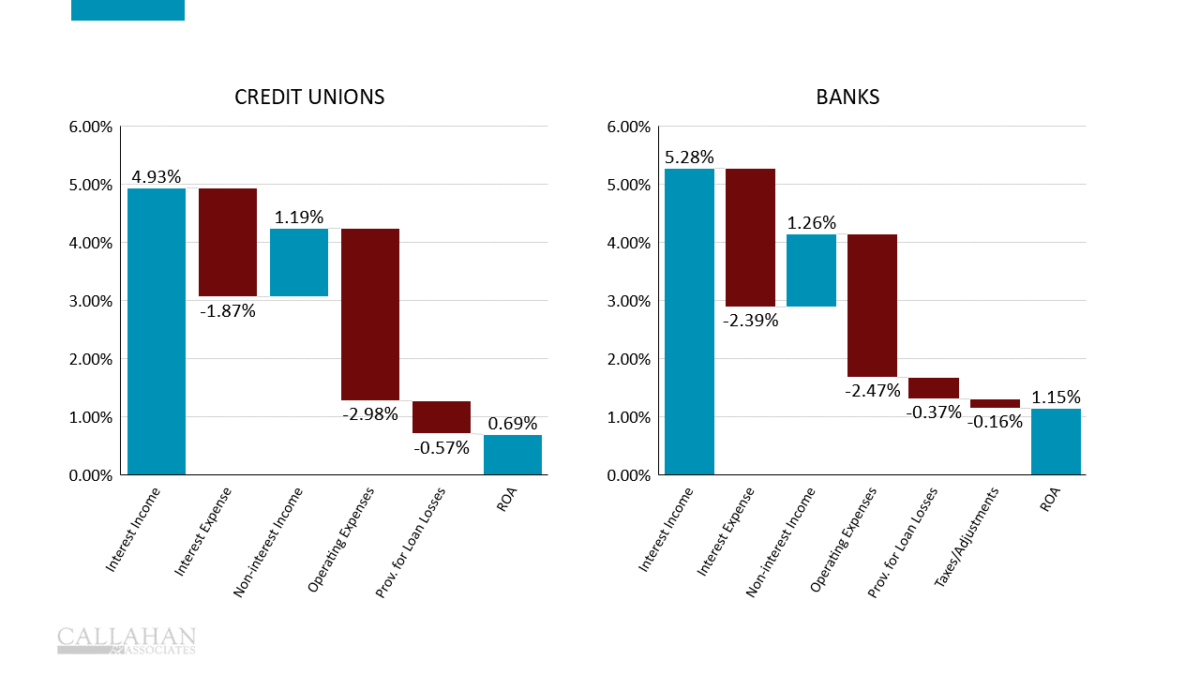
When it comes to operating expenses, credit unions’ 2.98% ratio is 51-basis-points higher than banks; not surprising given credit unions’ smaller size and scale and focus on local service. Inflation has underpinned a rise in operating expenses the past few years, and many credit unions are looking for ways to improve efficiencies, including through tactical partnerships with specialized vendors.
Given their smaller average asset size and close connection to members, credit unions must be diligent in defining — and sticking to — an asset quality strategy. As credit unions often serve lower income households — a demographic many banks would look to dilute on their balance sheet or avoid outright — they set aside a greater percentage of loan loss provisions to average assets than their banking counterparts. As of midyear, that was 0.57% versus 0.16%, respectively. The PLL expense allows credit unions to reach underserved members while still protecting the stability of the overall membership.
Taking all these metrics into account, banks still make significantly more in profits compared to credit unions, even after their tax hit. The ROA of credit unions was 46 basis points lower than banks at midyear. Instead of padding the pocketbooks of shareholders with those returns, however, credit unions instead direct their earnings toward lower loan rates, greater allowances for lending, and stronger member service.
How Does Your Midyear Performance Compare? Sit down with a Callahan advisor to review your tailored performance packet, and we’ll show you how your credit union measures up against others. Armed with this knowledge, your leadership team can make better plans and set stronger goals for 2025 and beyond. What are you waiting for? Request Your Packet Today.