The industry is adapting to a changing economic landscape under the lingering shadow of the COVID-19 pandemic. Credit union balance sheets expanded at record rates over the past year, particularly in deposits and mortgage balances. However, low interest rates suppressed earnings, and net worth ratios have declined accordingly.
The industry remains well-capitalized for the moment; still, credit union decision-makers are looking for new ways to boost income in 2021 and generate the capital necessary to keep up with continued balance sheet growth.
Last week, Callahan hosted its quarterly Trendwatch webinar. Here are three takeaways.
Learn about quarterly performance trends and glean insights into vital financial and operational metrics in Callahan’s quarterly performance webinar, Trendwatch. Watch today.
1. A second round of federal relief underpinned a continued surge in share balances.
Between March 31, 2020 and March 31, 2021, share balances expanded 23.2%. This is the fastest 12-month rate on record and was driven, in part, by two (and a half) federal relief packages. Core deposit products consisting of share drafts, regular shares, and money market shares accounted for 107.5% of new deposits during the year. Share certificate balances declined 9.3% during the period.
In today’s low-rate environment, cheap, liquid, core deposits helped credit unions reduce interest expenses. As a result, the industry’s average cost of funds declined 44 basis points year-over-year to 0.53%.
On the lending side, non-real estate loan originations were down for much of the past year as quarantines kept members at home and reduced their day-to-day spending. Consumer originations have shown signs of a rebound in the first quarter of 2021, particularly in the used auto space; however, many members have used some of their additional funds to pay off high-interest loan balances, such as credit cards.
The dynamics in the two portfolios combined to drive the industry’s loan-to-share ratio down to 68.7% as of March 31. That’s a decline of 4.5 percentage points from last quarter and 12.4 percentage points from one year ago.
LOAN-TO-SHARE RATIO
FOR U.S. CREDIT UNIONS | DATA AS OF 03.31.21
Callahan & Associates | CreditUnions.com

The loan-to-share ratio neared decade-long highs at the end of 2019, and credit unions were worried about liquidity. Those concerns evaporated during the past year as multiple federal relief packages, including one in the first quarter of 2021, underpinned a surge in shares and a drop in the loan-to-share ratio.
2. Record asset growth pushed down capitalization ratios; now credit unions are adjusting their earnings strategies.
Members added deposits faster than credit unions could lend them. Consequently, asset balances at credit unions increased 19.1% year-over-year a 12-month record.
As most members opted to hold their shares in withdrawable core deposit accounts, cash and equivalents up 82.8% annually provided valuable liquidity for credit unions. However, these low-yielding cash balances, in combination with the Federal Reserve rate cuts, suppressed interest spreads at credit unions, and net worth balances grew just 8.3% year-over-year a solid rate, but it lags behind the pace of asset growth. As a result, the industry’s net worth ratio dropped 1 percentage point from one year ago to 10.0% as of March 31, 2021.
NET WORTH AND OTHER CAPITAL RATIOS
FOR U.S. CREDIT UNIONS | DATA AS OF 03.31.21
Callahan & Associates | CreditUnions.com
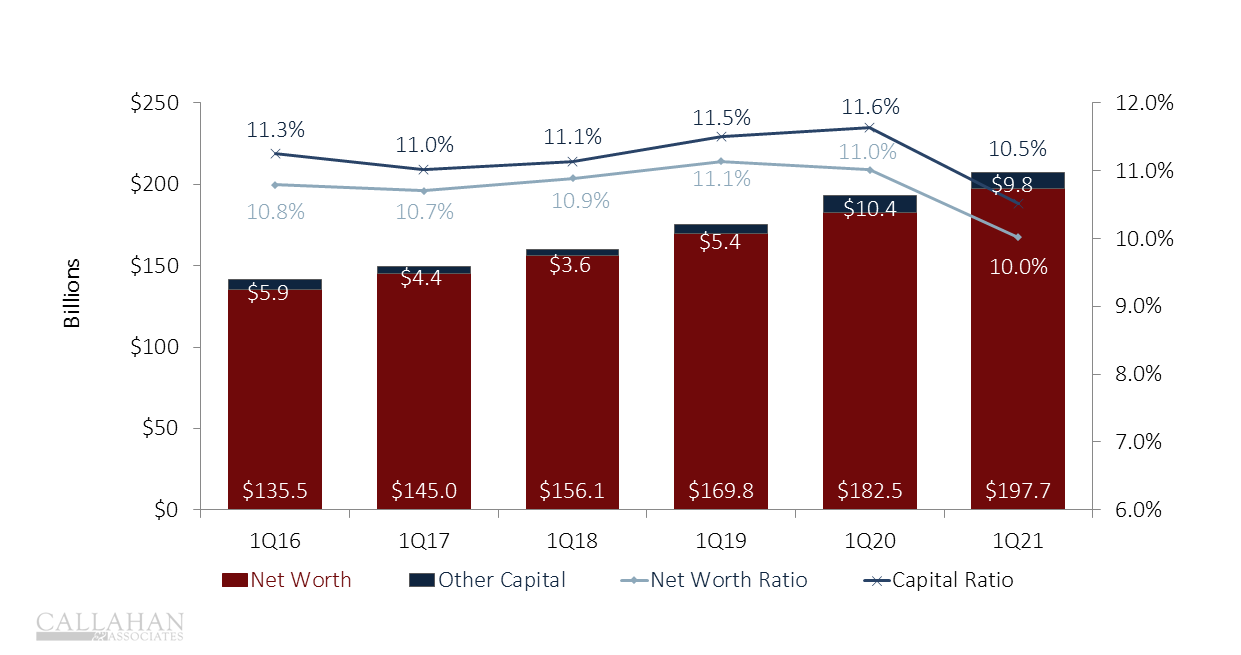
Although capital totals increased year-over-year in dollar terms, capital ratios fell as credit unions adjusted earnings strategies to keep pace with sustained asset growth.
The industry, well aware of its declining capitalization, is deploying new strategies to drive earnings. The return on assets ratio has improved through each of the past four quarters, from a low of 0.52% in the first quarter of 2020 to 1.03% in the first quarter of 2021 the highest of any quarter since 2002.
Interest spreads have yet to recover as benchmark rates remain near zero, but credit unions are generating earnings through alternate routes. The operating expense ratio declined 41 basis points year-over-year to 2.75%, showing credit unions controlled spending even while managing record levels of assets. Non-interest income, led predominantly by revenue from first mortgage sales to secondary markets, was 29.0% higher in the first quarter of 2021 than one year ago. Finally, year-to-date provision expenses declined 66.1% year-over-year. Credit unions now consider themselves well-covered from an asset quality perspective and are redirecting funds toward recapturing capitalization.
EARNINGS MODEL
FOR U.S. CREDIT UNIONS | DATA AS OF 03.31.21
Callahan & Associates | CreditUnions.com
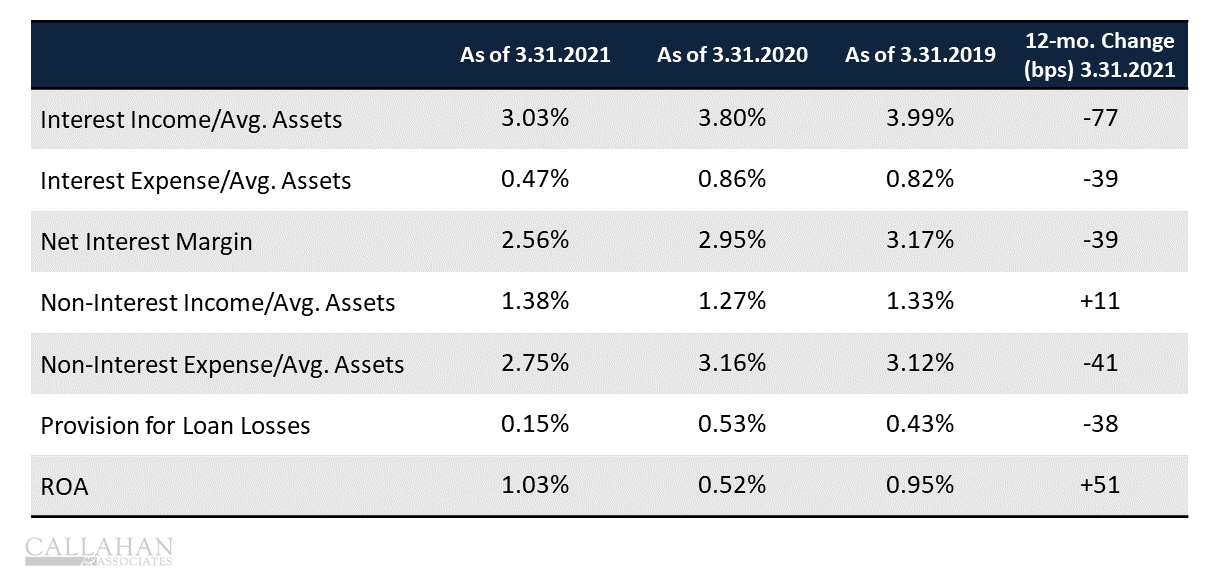
Credit unions are using far different methods to generate returns than they were two years ago, but the industry has fully recovered from an earnings perspective and have surpassed pre-Covid ROAs.
3. Delinquency dropped to record lows, continuing to defy expectations from one year ago.
The onset of COVID-19 and subsequent spike in national unemployment prompted credit unions to increase their provision expenses and add funds to their allowance for loan and lease loss accounts. The decline in asset quality that credit unions were preparing for, however, has yet to materialize at the national level.
During the 12 months ending in March 2021, allowance balances increased 26.6% to $12.9 billion; outstanding delinquent loans, however, were down 24.3% to $5.4 billion. The industry’s coverage ratio the amount set aside to cover every dollar in delinquency increased 95.6 percentage points annually to 237.6%. This is the first quarter on record that allowance balances have more than doubled the total amount of delinquent loans.
As with share growth, federal relief has supported asset quality during the past year, leaving credit unions with an open question: Will delinquency remain at record lows if government intervention diminishes? Although no one knows the answer, vaccination numbers and reopened economies have credit unions feeling optimistic enough to focus their resources on other issues such as capitalization and all-time high coverage ratios provide them with the flexibility to do so.
ASSET QUALITY
FOR U.S. CREDIT UNIONS | DATA AS OF 03.31.21
Callahan & Associates | CreditUnions.com
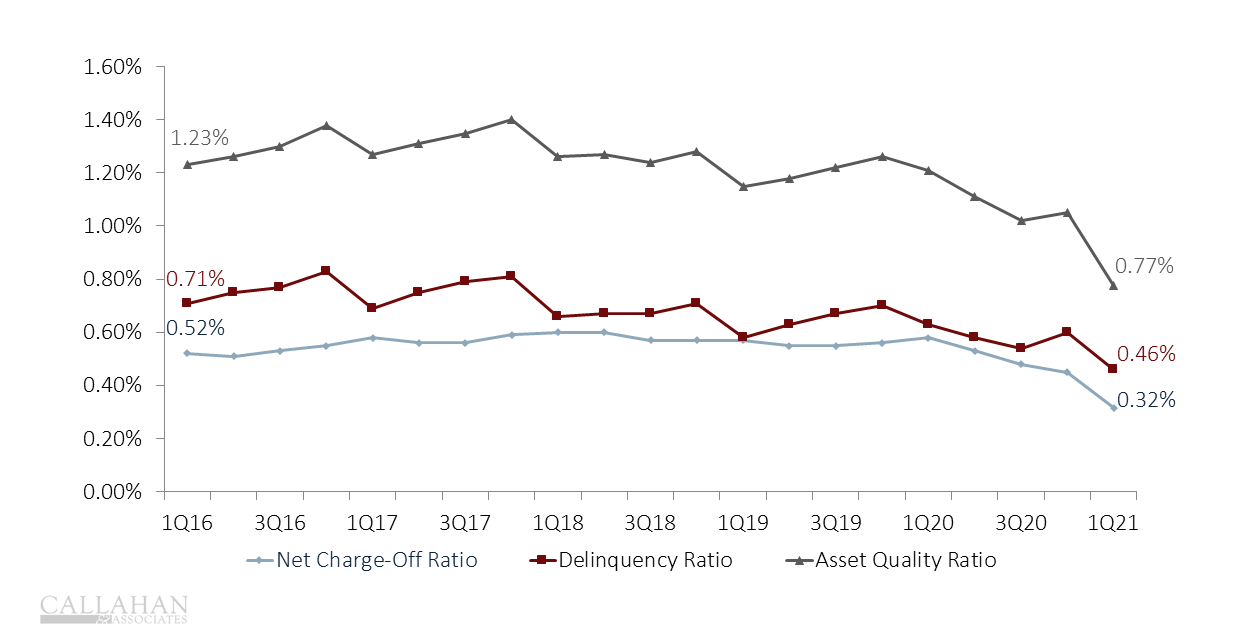
Delinquency and net charge-off ratios fell to their lowest levels on record as members used funds from the second round of federal relief to make on-time loan payments.
Customize A Data Scorecard With 1Q21 Data
1Q21 industry data is here and we want to send you a custom scorecard. Pick 10 ratios most important to your credit union and we’ll compare you to relative credit union and banking peers.
Learn More ![]()