After an eventful first quarter for the financial services sector, the second quarter brought relative stability in some areas and a continuation of caution in others. Liquidity concerns persisted in the second quarter, and cooperatives responded by turning to share certificates and borrowed funds.
Meanwhile, interest margins trended upward and loan balances on credit union balance sheets expanded as rates rose. The widely predicted recession did not materialize — unemployment was at near-historic lows and financial markets performed better than many had anticipated at the year’s outset. There’s a lot for both credit unions and members to be optimistic about in the second half of the year.
For more on these trends and others, click here to view the full 2Q23 Trendwatch webinar.
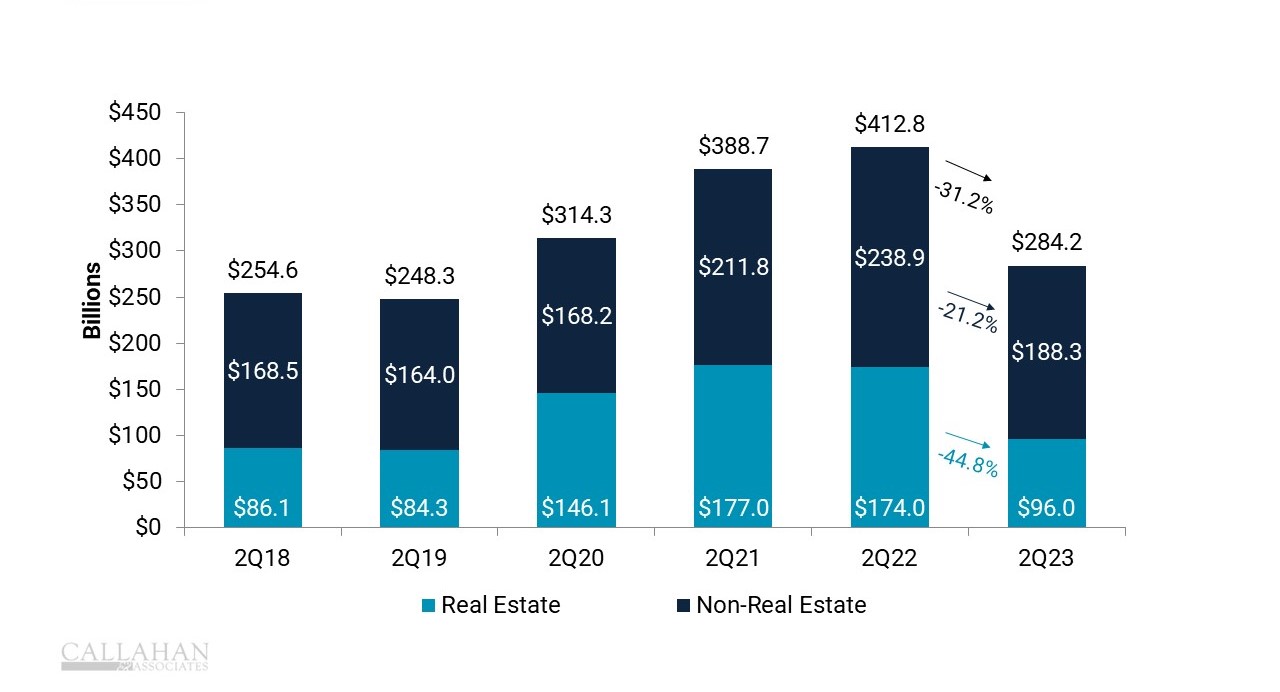
No. 1: Loan Originations Slowed
YTD LOAN ORIGINATIONS
FOR ALL U.S. CREDIT UNIONS | DATA AS OF 06.30.2023
© Callahan & Associates | CreditUnions.com

- The real estate market contracted due in part to steadily rising interest rates. However, it’s not just the real estate sector where lending activity cooled. Non-real estate originations — mainly auto loans and credit cards — declined 21.2% year-over-year.
- However, it is important to frame this slowdown in the context of the unprecedented lending environment of the last three, COVID-influenced years. If you compare 2023’s loan origination pace to industry totals through this point in 2019 (pre-pandemic), the industry has reported healthy expansion.
- The average price for a new car increased 1.6% year-over-year to $48,808 as of June 30, according to Kelley Blue Book. This was the smallest annual increase in three years, thanks to inventory returning to healthy levels.
NO. 2: Certificates Boomed; Core Deposits Declined
12-MONTH SHARE GROWTH
FOR ALL U.S. CREDIT UNIONS | DATA AS OF 06.30.23
© Callahan & Associates | CreditUnions.com

- Liquidity concerns remained the top priority for many credit unions. To counteract tightening liquidity, cooperatives embraced share certificates on a large scale, leading to 68.7% annual growth in balances. Credit unions leveraged this approach to attract more funds from members and fuel lending.
- Core deposits — share drafts, regular shares, and money market accounts — declined 9.4% annually, giving credit unions little choice but to offer certificate specials and borrow funds. Balances for the latter increased 79.1% year-over-year.
NO. 3: Asset Yields Rose; So Did The Cost Of Funds
YIELD ANALYSIS
FOR ALL U.S. CREDIT UNIONS | DATA AS OF 06.30.23
© Callahan & Associates | CreditUnions.com

- Members took advantage of higher rates on certificates, which pushed up the industry’s cost of funds 15 basis points quarter-over-quarter.
- Higher interest income countered higher interest expense, leading to a 2-basis-point expansion in the industry’s net interest margin from one quarter ago. The increase in interest income came from yields on loans and investments expanding 11 basis points and 23 basis points, respectively.
NO. 4: Higher Delinquency Suppressed Asset Quality
ASSET QUALITY
FOR ALL U.S. CREDIT UNIONS | DATA AS OF 06.30.23
© Callahan & Associates | CreditUnions.com

- Asset quality normalized in the second quarter as delinquency rates among credit card and used auto borrowers rose nationally. Delinquency rates on these products reverted to pre-pandemic levels whereas net charge-offs were relatively flat following a CECL-related jump in the first quarter.
- However, not all loan products posted higher delinquency. Real estate delinquency — both residential and commercial — remained low, indicating members are prioritizing their home payments amid tightening budgets.
NO. 5: Interest Income Led Total Revenue Higher
TOTAL REVENUE
FOR ALL U.S. CREDIT UNIONS | DATA AS OF 06.30.23
© Callahan & Associates | CreditUnions.com

- Encouragingly, credit union revenue ticked up in the second quarter thanks largely to the surge in interest income. Income from loans increased 36.5% year-over-year; investment income jumped 112.6%.
- Fee income and other operating income increased only 1.1% and 0.7%, respectively. Fewer mortgage originations resulted in a decline in origination fees, but this was offset by higher income from late loan payment fees.
What’s Your Strategy For The Third Quarter?
Second quarter data provides plenty of guidance for the year ahead. A complimentary scorecard from Callahan & Associates will help you monitor your KPIs and identify trends, empowering you to adjust your strategies now to meet next quarter’s goals. Claim your scorecard today.
