The financial industry experienced a bumpy first quarter, bookended by continued interest rate increases and the collapse of Silicon Valley Bank. Meanwhile, credit unions rearranged their balance sheets in preparation for CECL as the economy continued chugging along.
Many first quarter trends were continuations of those from previous quarters, such as low share growth, a decline in loan originations, and an increased net interest margin. Credit unions continued to add members at a record pace as consumers seek safe harbor amid a messy economic environment. Looking for a place to park their money, members opted for share certificates at levels never seen before.
No.1: Total Share Growth Drops To Record Low
Total Shares and Annual Growth
FOR U.S. CREDIT UNIONS | DATA AS OF 03.31.23
© Callahan & Associates | CreditUnions.com
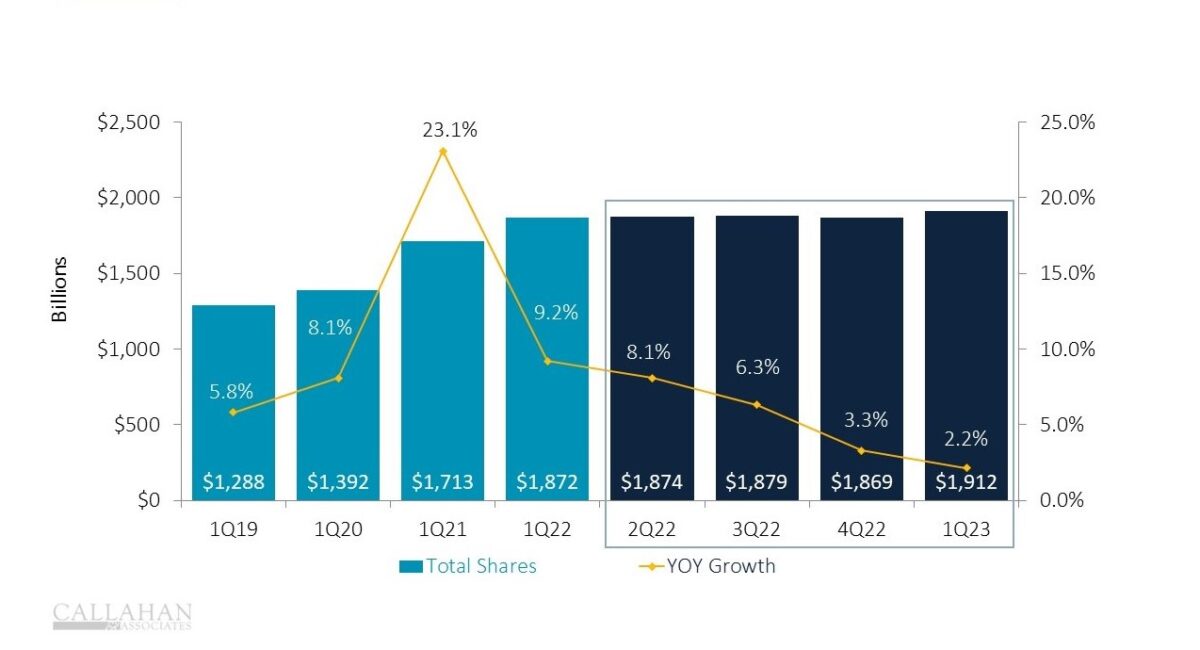
- Year-over-year share growth hit 2.2% to stand at $1.9 trillion shares outstanding. Despite that impressive dollar figure, this represents the lowest annual growth rate on record. As the personal savings rate hovers near historic lows and inflation tightens budgets, members have less and less to deposit into their credit union.
- Notably, share certificates continued their rapid rise, up 50.1% year-over-year. Share certificates now make up 19.1% of total shares outstanding. The cost of deposits also rose 51 basis points to 0.99% in the first quarter as deposits garnering higher interest rates make up a larger percentage of the share composition.
No. 2: Loan Demand Declines As Interest Rates Rise
YTD Loan Originations
FOR U.S. CREDIT UNIONS | DATA AS OF 03.31.23
© Callahan & Associates | CreditUnions.com
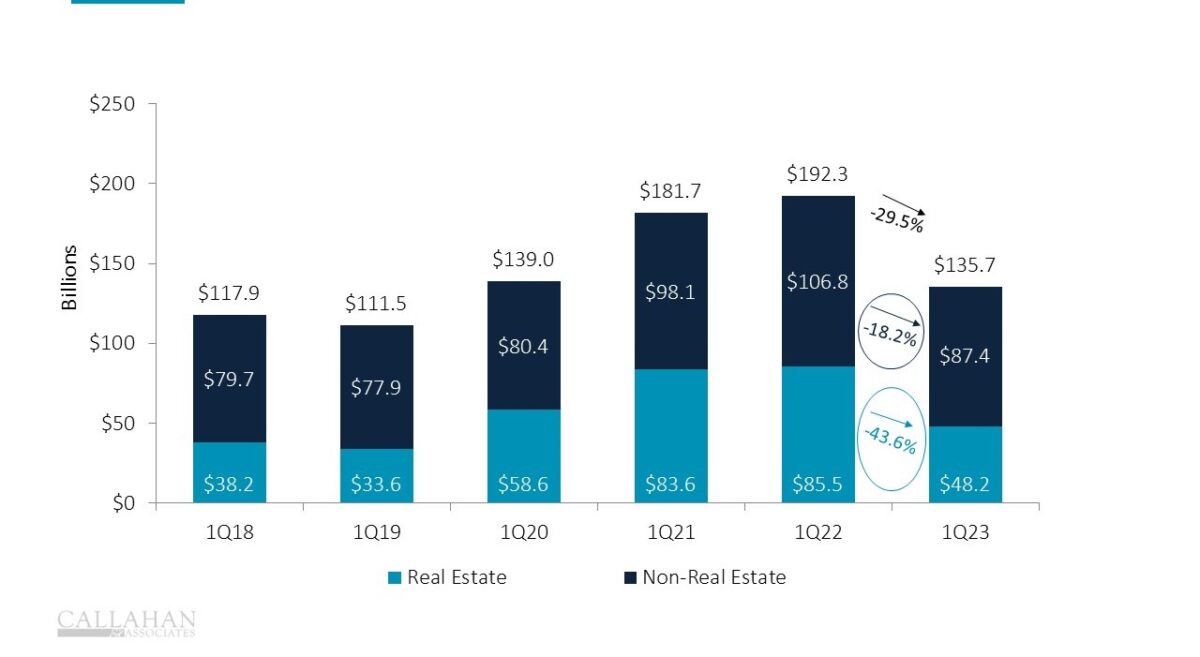
- Year-to-date loan originations declined 29.5% in the first quarter, sitting at $135.7 billion. In the first quarter of 2022 this stood at $192.3 billion. Real estate loan originations shrank 43.6% while non-real estate originations fell 18.2%.
- With the price of homes and cars continuing to rise alongside interest rates, would-be borrowers are feeling the pinch. The average new car sold for nearly $48,008 in March, according to Kelley Blue Book. Federal Reserve data shows that’s 20% higher than the average price in March 2019, one year before the pandemic, economic uncertainty, and supply chain shortages caused massive disruption to the auto market.
Do More With Your Data
Callahan’s Peer Benchmarking Suite offers a deep dive into the performance analytics of your institution against comparison groups. Whether you’re looking for information on the institutions in your market or those of your asset size around the nation, Peer gives you the insight you need to make smart, strategic business decisions.
Request A Demo
Request A Demo

No. 3: Credit Unions Stock Up On Allowances
Allowance for Loan & Lease Losses and % of Loans
FOR U.S. CREDIT UNIONS | DATA AS OF 03.31.23
© Callahan & Associates | CreditUnions.com
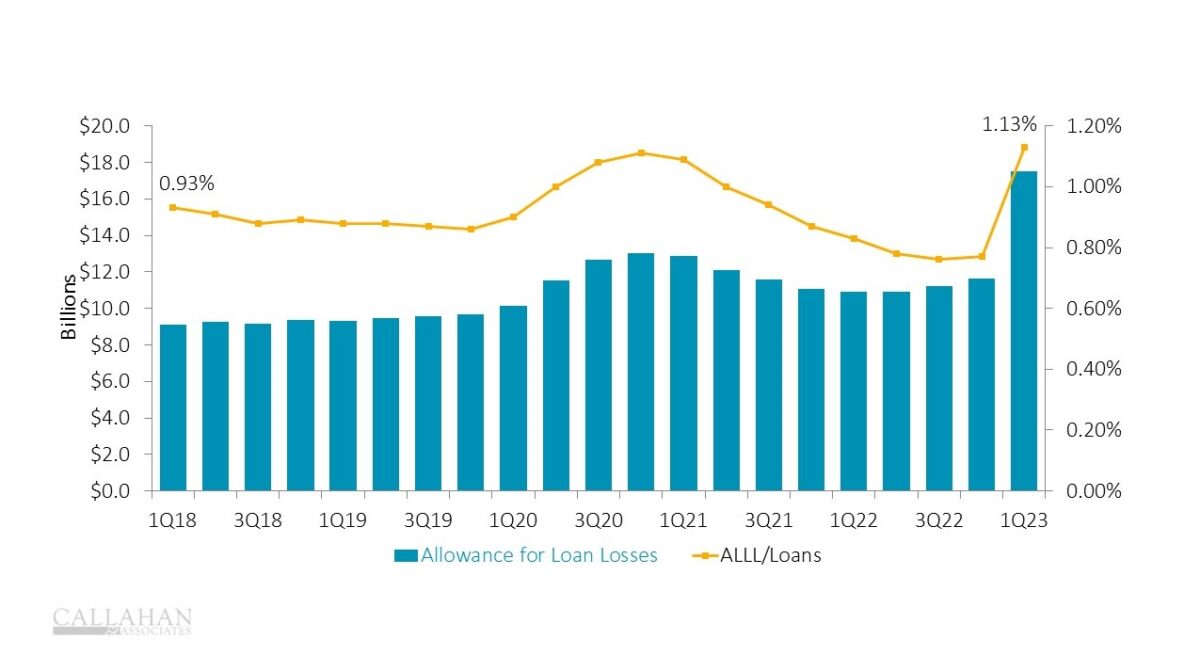
- The allowance for loan and lease losses rose substantially in the first quarter, up to 1.13% of loans outstanding. As these allowances are designed to cover losses on loans, new CECL charge-off methodology caused credit unions to stock up to ensure they provide coverage for loans deemed unrecoverable.
- This rise in allowances brings the coverage ratio – the amount set aside in allowances for every dollar of delinquent loans – to 215.4%, or more than double the dollar amount potentially needed. This comes at a time when asset quality is worsening throughout the credit union industry.
No. 4: Net Interest Margin Gains Continue For Second Straight Quarter
Net Interest Margin vs. Operating Expense Ratio
FOR U.S. CREDIT UNIONS | DATA AS OF 03.31.23
© Callahan & Associates | CreditUnions.com
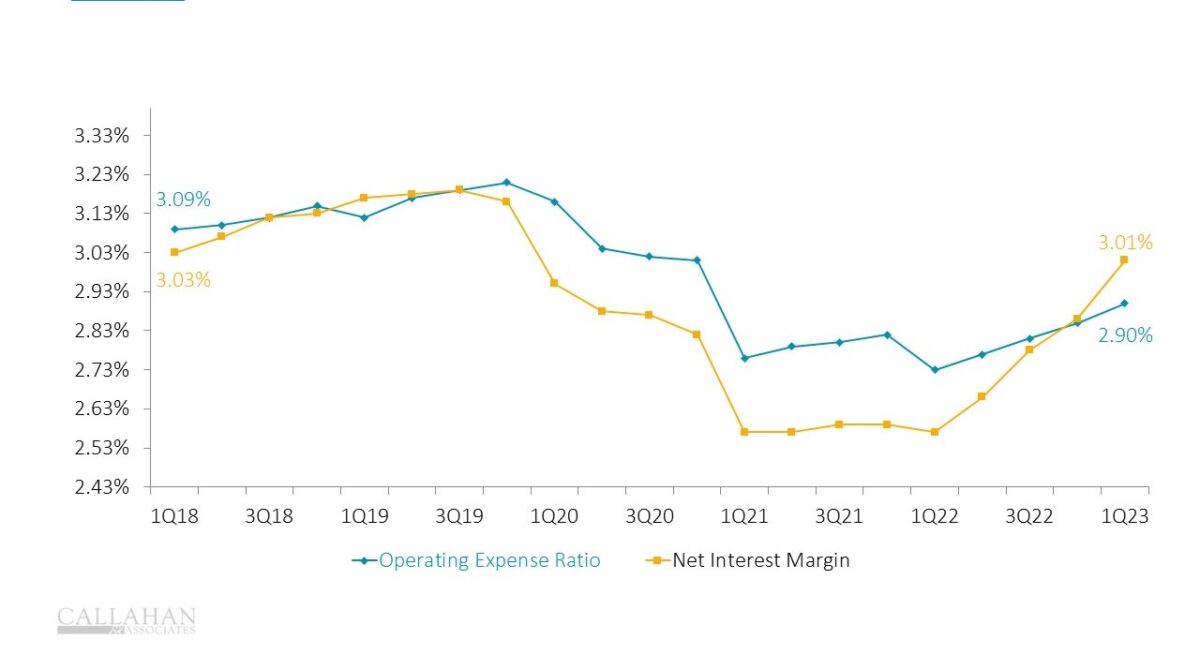
- The credit union industry’s net interest margin (NIM) continues to climb, outpacing the operating expense ratio. The current NIM level represents an improvement over the record low hit during the first quarter of 2022, as interest income continues to grow faster than interest expense.
- While operating expenses as a percentage of average assets has also grown, that metric has lagged the NIM growth rate, allowing the NIM to surpass the operating expense ratio. Now, the credit union industry has more flexibility on income streams and can keep the lights on with less non-interest income. Consequently, non-interest income has fallen year-over-year over the past two years.
No. 5: Membership Continues To Grow With Average Member Relationship
Net Membership and Annual Growth
FOR U.S. CREDIT UNIONS | DATA AS OF 03.31.23
© Callahan & Associates | CreditUnions.com
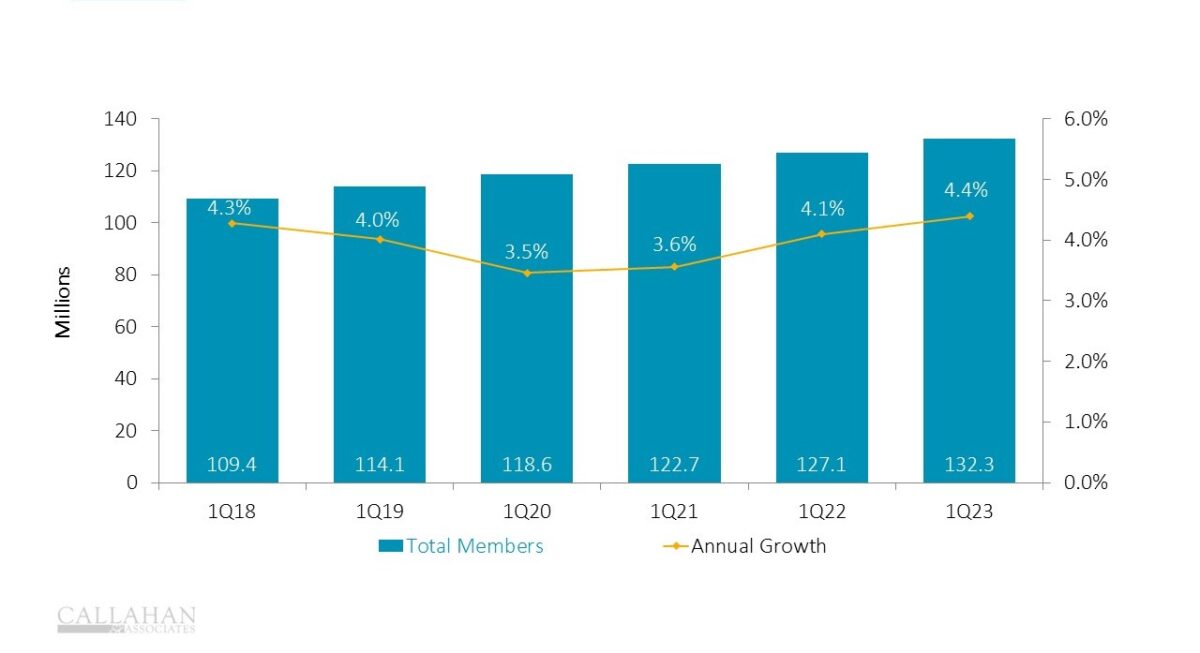
- Membership grew 4.4% year-over-year, continuing the exceptional run of growth credit unions have experienced in the last five years. This amounts to 5 million new members over the past 12 months.
- The average loan balance per member rose by more than $1,100. However, it is notable that the average share balance per member fell by nearly $400, as savings have been tough to come by for many Americans.
How Do You Compare?
Use industry data to determine how your credit union performs against others, uncover new areas of opportunity, and support your strategic initiatives. Callahan’s credit union advisors are ready to show you how — are you ready to see how you stack up?
Schedule Your Peer Demo
Schedule Your Peer Demo