Top-Level Takeaways
-
Loan originations set new record highs for the past three quarters, wrapping up a decade of growth.
-
Penetration rates continue to rise alongside membership, showing that American consumers are joining and engaging.
-
Auto lending continues to be where credit unions have the highest market share, despite a slowdown in indirect lending growth.
Building on momentum that began in the depths of the Great Recession, credit unions wrapped up 2019 by extending the most credit in the form of $158.2 billion in loan production in a single quarter in the movement’s century-long history. In fact, that record was set and extended each of the past three quarters.
While auto loan growth has slowed as the result of a shift away from indirect lending, lending to homebuyers more than made up the difference. Total first mortgage originations over the past 12 months reached $557.5 billion, after a $511.2 billion year in 2018, both record years.
Overall, in the decade following the Great Recession, cooperatives nationwide expanded assets 76.8% to $1.5 trillion as of year-end 2019. Over that time, membership grew 33.6% to 121.8 million, loans were up 93.1% to $1.2 trillion, shares surged 75.1% to $1.3 trillion, and the number of full-time equivalent employees expanded 36.3% to 316,623.
Growing Membership Engagement
Adding members and deepening their relationships has been integral to the success credit unions have experienced over the last decade. Credit union membership totaled 121.8 million by the end of 2019, a 3.6% increase from the year prior. Credit unions added just under 4.3 million members in the past 12 months.
Engagement measures also show continued strength. Penetration rates can be pushed up by reducing member rolls, through purging inactive accounts, for instance. That’s not what’s happening here. New members are being added, and they’re using their credit unions products and services.
For example, average member relationship, the combined loan and share balances per member (excluding business loans), is up 35.2% since 2009 to $19,472 as of December 2019. In the past year, the average loan balance per member grew 1.9% to $8,613 while the average share balance jumped 4.4% year over year to $10,860.
Credit unions opened almost 1.1 million share draft accounts in the fourth quarter alone, another sign of deeper relationships between members and credit unions. Share draft penetration, an indicator of whether members use their credit union as a primary financial institution, expanded 1.1 percentage points over the last 12 months to 58.8% at year-end 2019. This is up 12.2 percentage points over the decade and is an all-time high for the industry.
Total shares increased $101.5 billion, or 8.2%, in the last year, totaling $1.3 trillion as of the fourth quarter. Certificates continued to increase at the fastest annual rate, up 20.5% year-over-year. Over the last 12 months, certificates accounted for 48.6% of total share growth. The overall inflow of deposits has pushed the loan-to-share ratio down between the third and the fourth quarter for the first time since 2015.
LOAN, SHARE, AND MEMBER GROWTH
FOR U.S. CREDIT UNIONS | DATA AS OF 12.31.19
Callahan & Associates | CreditUnions.com

Despite slowing loan and member growth over the past 12 months, credit unions report strong expansion through December 2019.
SHARE GROWTH CHANGE
FOR U.S. CREDIT UNIONS | DATA AS OF 12.31.19
Callahan & Associates | CreditUnions.com

Certificates grew 20.5% year-over-year, comprising 48.6% of overall share growth in 2019.
LOAN-TO-SHARE RATIO
FOR U.S. CREDIT UNIONS | DATA AS OF 12.31.19
Callahan & Associates | CreditUnions.com
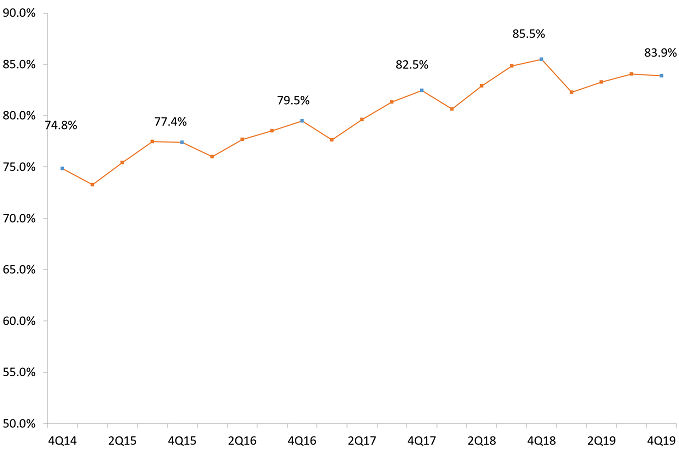
As share certificate specials brought in deposits, the loan-to-share ratio decreased between the third and fourth quarter for the first time since 2015.
LOAN ORIGINATIONS
FOR U.S. CREDIT UNIONS | DATA AS OF 12.31.19
Callahan & Associates | CreditUnions.com

1st mortgage production expanded 28.2% year-over-year, spurring total year-end loan origination volume to the highest levels ever reported.
LOAN COMPOSITION
FOR U.S. CREDIT UNIONS | DATA AS OF 12.31.19
Callahan & Associates | CreditUnions.com

At the expense of auto loans, first mortgages make up a greater portion of the loan portfolio than last year.
NET INTEREST MARGIN VS. OPERATING EXPENSE RATIO
FOR U.S. CREDIT UNIONS | DATA AS OF 12.31.19
Callahan & Associates | CreditUnions.com

The industry’s net interest margin fell back below the operating expense ratio, reflecting the increase in deposits paying higher interest rates.
Increased Lending
Credit unions wrapped up the decade with the largest three-month loan origination volume on record. In the fourth quarter alone, credit union loan production reached $158.2 billion. This is the third consecutive quarter of record quarterly origination levels. In the three months between April and June, loan production at credit unions nationwide was $136.7 billion; between July and September, credit unions originated $151.1 billion. In 2019, credit unions originated $557.5 billion in loans, more than any year on record. This is up 9.1% year-over-year from $511.2 billion reported in 2018.
Mortgage lending fueled loan production in 2019. Year-end first mortgage originations increased 28.2% year-over-year to $178.4 billion, another industry record. Consumer originations increased modestly, up 2.2% over the last 12 months. This is largely a result of slowing auto loan growth. Auto balances increased 2.5% year-over-year, on the back of decelerating indirect lending, which was up 2.7% annually as of the fourth quarter.
Credit unions nationwide continue to push their product usage rate up as they deepen and diversify relationships with members. More than one in five members has an auto loan with their credit union. Auto loan penetration increased 7 basis points annually to 21.3% by year-end 2019. Additionally, credit card penetration expanded 13 basis points over the year, and 3.3 percentage points over the decade, to 17.9% as of year-end 2019.
Market share at the nation’s cooperatives also grew over the decade. The industry’s share of revolving consumer loans reached 6.2% at the end of the decade, up from 3.9% in 2009. Credit unions reported 21.7% market share in auto loans in the fourth quarter of 2019, which continues to be where cooperatives are most competitive. This is up 5.5 percentage points over the last 10 years. Credit unions share of the mortgage market increased 3.8 percentage points since year-end 2009 to 8.6% at year-end 2019.
The Bottom Line
Credit unions are managing their bottom line well. Revenue totaled $82.7 billion at year-end 2019, an 11.2% increase from the year prior. Interest income expanded 13.5% annually, while non-interest income increased 7.1%. The industry’s ROA was 0.93% at the end of 2019, up 1 basis point from year-end 2018.
Nationally, the net interest margin expanded 4 basis points year-over-year to 3.17% as of the fourth quarter but contracted 2 basis points from the third quarter of 2019. This is due to funding expenses growing at a faster pace than interest income because of sustained certificate growth and flat loan yields.
The net interest margin fell back below the operating expense ratio after briefly rising above operating expense in the previous quarter, a change mostly driven by the influx of shares attracted by rising deposit and certificate rates. That creates more liquidity for credit unions to do what they do best: extend credit.