The rapid increase of interest rates finally shocked the economy in the first quarter of 2023, and three now-infamous financial institutions found themselves in precarious balance sheet management positions.
Silicon Valley, First Republic, and Signature Banks — all of which serve the Silicon Valley tech industry — faced serious liquidity issues as rising rates wreaked havoc on the resale value of their investment portfolios. Simultaneously, the technology industry hit financial trouble, forcing many depositors to withdraw funds. Consequently, the institutions were forced to sell some investments at a hefty loss to cover those withdrawals.
Each of these banks also held a high percentage of deposits that exceeded the $250,000 per account insured by the FDIC. Once word got out about the run, account holders fearful of non-refundable losses in the event of a bank failure rushed to withdraw their money, rapidly exacerbating the liquidity crunch.
This chain of events ultimately resulted in the liquidation of the institutions and posed an existential crisis for financial institutions nationwide. Many, including credit unions, asked: How are we positioned relative to these troubled banks?
Credit Union Liquidity
Liquidity at credit unions has tightened substantially since the record share inflows of the 2021 peak-COVID era. The loan-to-share ratio — the percentage of deposit dollars an institution lends out — hit a low of 68.7% in the first quarter of 2021. Since then, however, it has risen nearly 13 percentage points to 80.9% as of March 31, 2023.
Additionally, accessible cash balances — money immediately accessible to account holders — now comprise 7.3% of industry assets. That’s down from the 15.3% two years ago.
Two primary dynamics have driven these trends. First, high inflation has stretched members’ budgets thin, resulting in weaker member savings. Second, higher interest rates — intended to fight inflation — incentivized credit unions to hold more originations on the balance sheet rather than selling them to the secondary market.
The Credit Union Investment Portfolio
When depositors withdrew their funds from the banking system — slowly, at first — the aforementioned banks were forced to sell investments to shore up liquidity. However, as interest rates increased, long-term investments declined in value and the banks had to sell them at a significant loss, which hurt bank capital and sparked panic.
For credit unions, total industry unrealized losses on investments reached $33.8 billion as of March 2023. That’s 14.1% of net worth. Holding these products to maturity would alleviate the loss but prevent near-term cash generation. Fortunately, some of these losses have matured off the books, and unrealized losses are down 11.7% since December 2022.
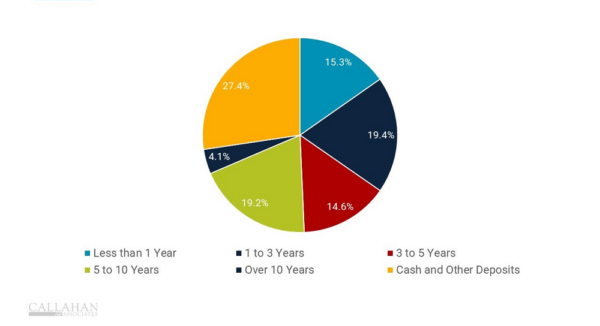
Longer-term securities are more sensitive to interest rate risk. At U.S. credit unions, 23.3% of investments mature in more than five years whereas 15.3% mature in less than one year. Investments act as a source of liquidity in the event of a bank run, and financial institutions with lower investment portfolio values can face tighter borrowing as investments are a source of collateral. During this period, the net liquid funds to short-term savings ratio — a comparison of investments and shares maturing within the next year — fell from a peak of 23.5 in the first quarter of 2021 to 10.0 two years later.
CREDIT UNION INVESTMENT PORTFOLIO
FOR U.S. CREDIT UNIONS | DATA AS OF 03.31.23
© Callahan & Associates | CreditUnions.com

CECL Impacts On Liquidity
As of the first quarter of 2023, credit unions are required to follow the new CECL regulations around credit losses. These regulations require credit unions to develop a new approach toward calculating charge-offs that shift allowances and provisions forward.
Credit unions increased provision expense 203.4% annually in the first quarter, reducing earnings and capital growth. Although the NCUA allows credit unions to rebuild this capital gradually, it nevertheless requires them to divert funds away from operations, loan funding, or dividend growth.
Uninsured Deposit Risk
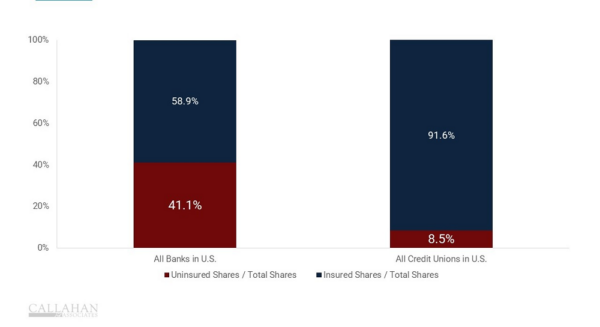
As depositors rushed to withdraw their unprotected funds, uninsured deposit risk became a key component of banking instability in the first quarter. Prior to the banking turbulence, banks experienced a rise in uninsured deposits, climbing to 41.1% of collective industry deposits. By comparison, only 7.4% of deposits at credit unions are uninsured.
Of note, and a key difference in the credit union model, many of the uninsured deposits at banks come from corporate customers. Credit union members tend to be individuals of modest means or smaller businesses with fewer deposits.
UNINSURED SHARES
FOR U.S. CREDIT UNIONS | DATA AS OF 03.31.23
© Callahan & Associates | CreditUnions.com

It’s no secret credit unions are experiencing tighter liquidity, but when compared to banks, cooperatives fared well during the first quarter’s banking crisis. A lower rate of uninsured deposits and strong member relationships helped protect credit unions from the panic of a bank run.
Rebounding investments and plateauing inflation created a better environment in the second quarter. Hopefully, this will ease liquidity restrictions and allow credit unions to direct more dollars toward building communities and supporting members.
How Are You Managing Your ALM Strategy?
LEARN MORE TODAY
