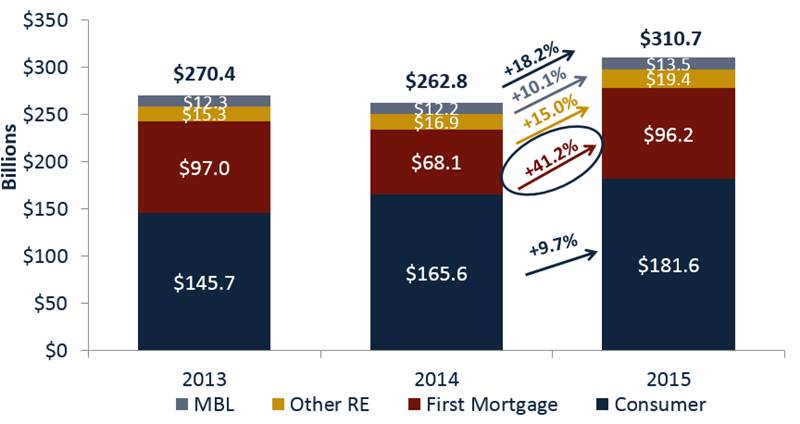
Total year-to-date credit union loan originations has increased more than 18% over the first three quarters of 2014, topping $310 billion as of Sept. 30. Put another way, credit unions have loaned more than $1 billion a day so far in 2015.
Although all categories posted strong growth, first mortgage originations, which includes both purchase mortgages and refinancings, recorded the largest percentage and dollar change versus one year ago. First mortgage originations increased $28.1 billion or 41.2% compared to the first nine months of 2014.
Other real estate loans, which includes home equity lines of credit, also posted notable year-to-date gains over 2014. The growth in this portion of the loan portfolio totaled 15.0% and balances exceeded $19 billion as of Sept. 30, 2015.
YTD LOAN ORIGINATIONS
For FirstLook credit unions | Data as of 09.30.15
© Callahan & Associates | www.creditunions.com
Source: Peer-to-Peer Analytics by Callahan & Associates
States all across the nation posted significant year-to-date growth in mortgage originations when compared to the same time frame last year. The 10 states that posted the strongest growth all exceeded 50% with the No. 1 state South Carolina nearly hitting 75%.
Nationally, credit unions captured 8.7% of the first mortgage market based on originations through the first nine months of the year, up from 8.1% over the same period in 2014.
| State | 1st Mortgage Originations YTD 2015 (in millions) |
1st Mortgage Originations YTD 2014 (in millions) |
Growth |
|---|---|---|---|
| South Carolina | $707,213,126 | $404,769,239 | 74.7% |
| Colorado | $2,557,911,095 | $1,498,864,583 | 70.7% |
| Minnesota | $1,837,573,786 | $1,097,611,000 | 67.4% |
| Hawaii | $389,375,856 | $232,693,667 | 67.3% |
| Nevada | $495,764,763 | $302,510,505 | 63.9% |
| Washington D.C. | $707,339,168 | $432,891,921 | 63.4% |
| Maryland | $1,244,287,599 | $774,487,593 | 60.7% |
| Rhode Island | $543,627,803 | $342,889,149 | 58.5% |
| Massachusetts | $2,812,186,125 | $1,775,892,910 | 58.4% |
| Missouri | $949,066,568 | $613,074,564 | 54.8% |