Top-Level Takeaways
-
Shoreline Credit Union is replacing indirect lending income with investment income.
-
The Wisconsin credit union conducts its own ALM modeling to quickly assess strategies.
Shoreline Credit Union($94.6M, Two Rivers, WI) is going a bit longer and lighter in its investments portfolio than the typical credit union, but it’s not just chasing yield for yield’s sake.
The Dairy State financial cooperative has given up its $1 million a month volume in indirect lending and is sharply cutting expenses and putting cash to work to make up for lost income.
Read more about Shoreline’s changing lending strategy. Check out Breaking The Indirect Addiction only on CreditUnions.com.
Leading that effort is Nathan Grossenbach, who joined the credit union as an accounting manager in 2013. Grossenbach became CFO in October 2014 and moved up to president and CEO in 2016. One of the first things the CPA did when he came on in 2013 was oversee the correction of approximately $1 million in ledger entries that had been overstating investments yield.
How Do You Compare?
It takes minutes to compare various aspects of your investment portfolio to other credit unions with Peer-to-Peer. Compare against credit unions in your state, asset range, or by business model.

The credit union also brought in-house asset-liability management, which Grossenbach says allows the Shoreline money managers to model impacts quickly, rather than waiting for an external advisor. That agility helps the credit union make market decisions that support its role as a community lender.
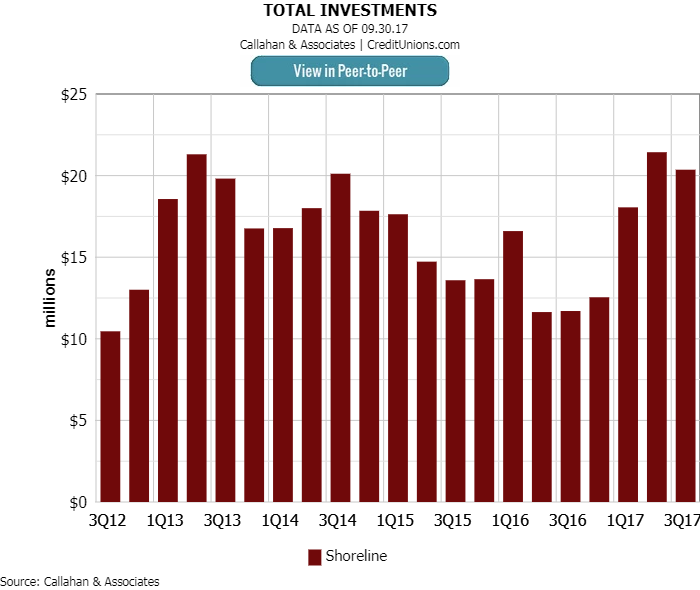
Shoreline Credit Union ramped up its total investments after nearing a five-year low in mid-2016. The credit union’s investment in government and agency securities soared 722% in one year, from third quarter 2016 to third quarter 2017, while simultaneously new and used auto loans plummeted 30.35% and 16.60%, respectively, as Shoreline exited indirect lending.
When Shoreline began exiting indirect lending in 2015, income plummeted. The credit union bought loan participations to make up for the deficit. Consequently, the investment portfolio dipped. At the same time, the credit union began shortening the overall maturity of its investments because of rising rates.
CU QUICK FACTS
Shoreline Credit Union
Data as of 09.30.17
HQ: Two Rivers, WI
ASSETS: $94.6M
MEMBERS: 10,066
BRANCHES: 7
12-MO SHARE GROWTH: 0.1%
12-MO LOAN GROWTH: -8.0%
ROA: 0.33%
Now, there’s a new emphasis on traditional lending and an investment portfolio that’s a laddered mix of traditional certificates and municipal and agency bonds, many of them with longer maturities than average, to provide an income flow that is better than the average yield.
Find out who tops the lists in some key measures. Check out Credit Union Leaders In 3 Investment Metrics only on CreditUnions.com.
We can take more risk because we understand our liquidity position and cash flow so well, Grossenbach says. Our regulators have been happy with it.
That hands-on understanding gives the credit union the confidence for strategies like this: Knowing over the next three months it has $2.5 million in incoming cash flow loan principal payments and loan prepayments, to name a few Shoreline can borrow that amount from the FHLB and use the money to buy CDs. It can then use the incoming cash flow to pay down the FHLB debt while earning an extra margin of profit on the CDs.
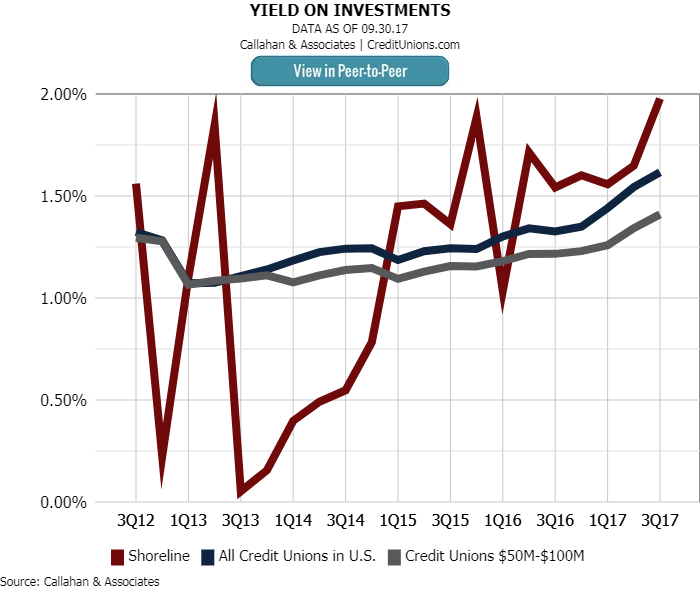
One million dollars’ worth of corrected entries helped drive down Shoreline’s yield on investments in 2013. Going a little long this year, meanwhile, has ramped that yield above national and asset-based peer group averages.
Shoreline’s investments strategy gives it an investment maturity profile different from the overall industry. For example, the industry total for cash and cash equivalents is 27.3%, compared with a relatively light 8.6% for Shoreline, according to data from Callahan Associates. For maturities in the one- to three-year range, the industry is at 24.2% whereas Shoreline is at 40%. Investments over 10 years in maturity comprise 1.2% of the national credit union portfolio; at Shoreline it’s 9.6%.ContentMiddleAd
Opportunistic investing buttressed by savvy in-house ALM has helped Shoreline keep in the black while it pivots its lending strategy to build deeper member relationships than typically afforded by an indirect loan. It can now quickly assess how, for example, its new 5/1 ARM loan will affect ALM in a rising rate environment.
Meanwhile, Grossenbach says, the senior managers and board are increasingly focused on another metric: the credit union’s ratio of operating expense to income. That’s currently 90.63%, compared with 77.87% for credit unions in its $50 million to $100 million asset class and 63.48% for all U.S. credit unions in the third quarter of 2017.
We’ve reduced expenses by 30%, closed a branch, and are producing more income from our staff, Grossenbach says. Now, we can focus on income, earning more yield from the cash we have on hand. We’re focused on using every dollar of assets in the best possible way.

