The differences in credit union and bank earnings models aren’t new. Today’s market, however, is making those differences harder to ignore. As rates, expenses, and credit costs test balance sheets across the financial services industry, familiar differences in margins, fees, and provisions are taking on new meaning.
A side‑by‑side look at earnings performance helps put those differences into context.
CREDIT UNION VS. BANK EARNINGS MODEL
FOR U.S. CREDIT UNIONS AND BANKS | DATA AS OF 12.31.2025
SOURCE: CALLAHAN & ASSOCIATES
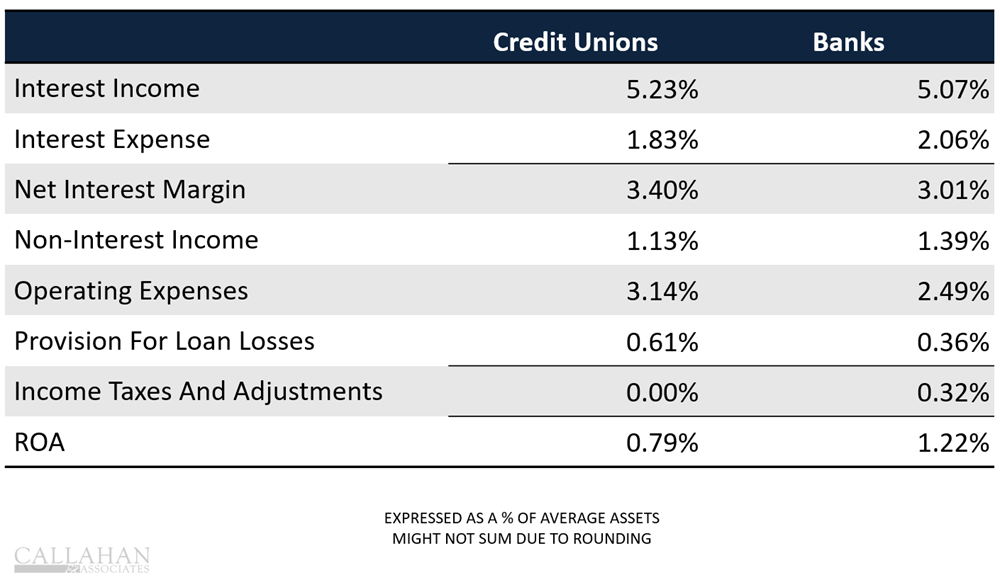
Strategic Insights
- Credit unions return value to their member-owners; banks return value to shareholders. For this reason, credit unions consistently run a return on assets well below their banking peers. That’s by design, not distress. In the fourth quarter, it was 43 basis points smaller, 0.79% versus 1.22% for banks.
- Higher rates are rewarding efficiency. Banks’ lower operating expense ratios give them more room to protect ROA as funding costs rise, whereas credit unions continue to absorb higher expenses to maintain pricing, service, and access for members.
- The net interest margin spread and the income tax exemption together help credit unions rely less on non-interest income, which, in turn, allows them to give back more to members in the form of lower fees, better rates on lending and savings products, patronage dividends, and more.
- The cooperative model prioritizes working with members on account challenges rather than offsetting costs through fees. Higher provision expenses indicate a greater willingness to extend credit to borrowers with weaker credit and less ability to repay, absorbing more risk to expand access even as household balance sheets tighten. That’s important during economic cycles when banks tend to pull back toward lower‑risk borrowers to preserve profitability.
- Credit unions use their tax-exempt status to return value to members, but the benefits of credit unions to local economies extend beyond membership perks. According to America’s Credit Unions, the federal credit union tax status in 2023 was valued at $2.9 billion, yet credit unions generated more than $297 billion in economic impact through personal financial support, small‑business lending, job creation, and more. That’s more than $100 generated for every $1 “lost” in tax revenue. What’s more, the mere presence of credit unions in local markets presents $10.5 billion in benefits for non‑members.
Don’t stop here. Dig deeper into the credit union earnings model with a look at how a changing rate environment impacts credit unions of different sizes in different ways. Read more in “One Industry. Different Earnings Models,” available exclusively for Callahan clients in the Callahan Client Portal. Read it today.