The level of growth across member metrics is telling both of the opportunity and demand in the market for financial services institutions that is not being fulfilled by banks, large and small.
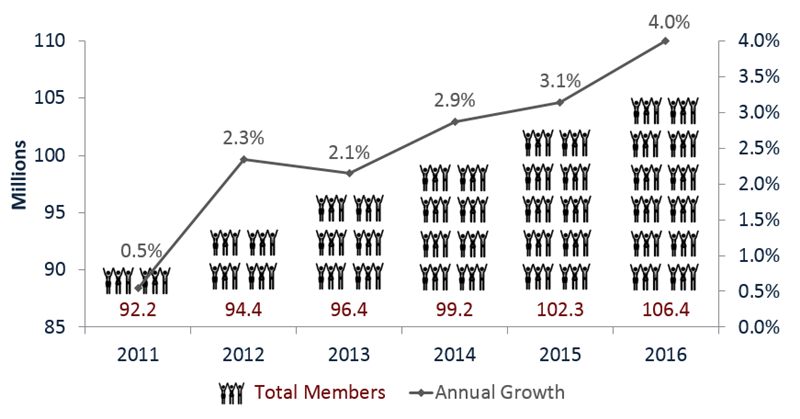
MEMBERSHIP AND ANNUAL GROWTH
FOR U.S. CREDIT UNIONS* | DATA AS OF 06.30.16
Callahan Associates | www.creditunions.com
*For 5,976 credit unions. Source: Peer-to-Peer Analytics by Callahan Associates
Membership has increased at the fastest second quarter rate since 2000. Credit unions now serving more than 106.4 million members.
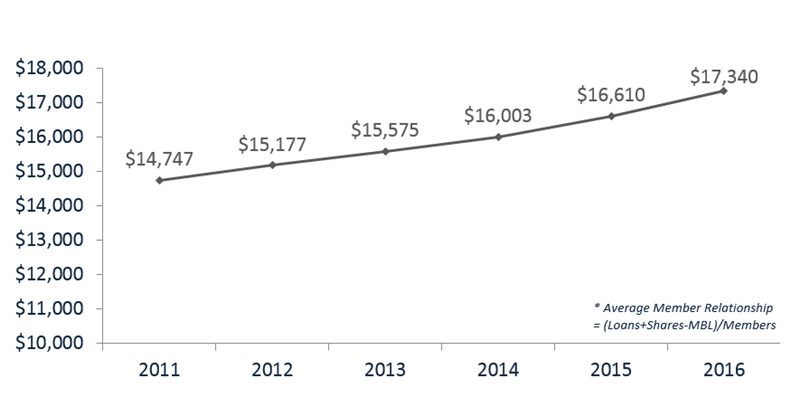
AVERAGE MEMBER RELATIONSHIP
FOR U.S. CREDIT UNIONS* | DATA AS OF 06.30.16
Callahan Associates | www.creditunions.com
*For 5,976 credit unions. Source: Peer-to-Peer Analytics by Callahan Associates
Average member relationship expanded 4.4% to $17,340 its highest level ever.
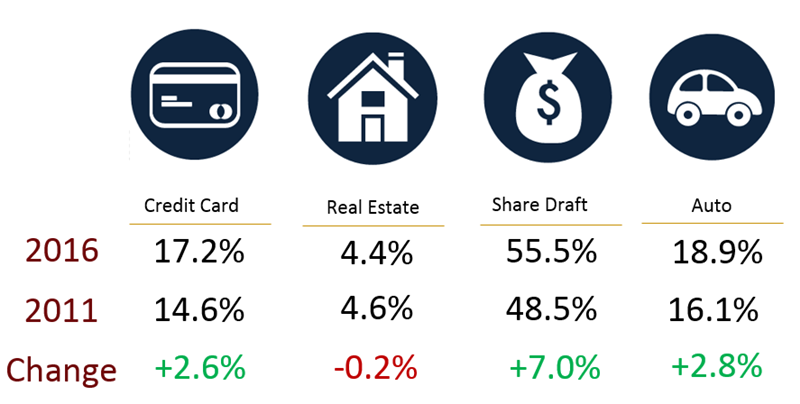
PENETRATION RATES
FOR U.S. CREDIT UNIONS* | DATA AS OF 06.30.16
Callahan Associates | www.creditunions.com
*For 5,976 credit unions. Source: Peer-to-Peer Analytics by Callahan Associates
Penetration rates are up year-over-year across major products, with share drafts in the lead. This indicates stronger and deeper relationships forming between members and their credit unions.
You Might Also Enjoy
-
The Year Of The Employee
-
How Alliant Plans To Triple Down On NII
-
How This Small Single-Sponsor Credit Union Hangs Tough