Consumer spending slowed and savings increased through the end of the second quarter as consumers looked for low-risk avenues to park their money. In an attempt to spur consumer activity, the Federal Reserve lowered interest rates to record lows. As a result, the credit union loan portfolio reported strong gains in the second quarter with outstanding loan growth industrywide accelerating 8 basis points annually to 6.5% as of June 30, 2020.
Credit unions granted $175.4 billion in loans in April, May, and June the most in any quarter on record. Mortgage originations, led by a surge in refinances, largely fueled this growth as homeowners and homebuyers alike took advantage of low rates.
When the uncertainty surrounding COVID-19 was near its peak in March, few would have predicted the record growth financial institutions would recorded in the coming months. The following three lending trends, in particular, could offer insight into where the industry will stand in 2021.
No. 1: Asset Quality Improves but the effects of forgiveness and deferral policies remain unclear.
The asset quality ratio defined as the delinquency ratio plus the net charge-off ratio improved 10 basis points during the second quarter, dropping to 1.11% as of June 30, 2020. Both the net charge-off ratio and the delinquency ratio fell 5 basis points to 0.53% and 0.58%, respectively from March 31, 2020.
Likewise, loans that have been delinquent for fewer than six months decreased significantly during the second quarter. Loans with a late payment of 30 to 60 days fell $5.7 billion, or 55.1%, from the first quarter. It is important to note these are not included in total reportable delinquency; however, early stage delinquency is an important harbinger of official delinquency increases. Loans that have been delinquent for more than six months increased 7.9% during the second quarter. Overall, delinquent balances have declined $198.0 million in the past 12 months and $502.4 million in the past three months.
Although overall asset quality has improved during the past year, loan forgiveness and payment deferral policies spurred on by the pandemic have created a lot of ambiguity in asset quality metrics. As such, credit unions should monitor their portfolios as well as indicators that shed light on the general state of member financial wellbeing, such as the fact unemployment remained at an elevated 11.1% as of June 30, 2020.
As loan forgiveness and payment deferral programs begin to expire, many consumers will face significant financial hurdles brought on or exacerbated by the pandemic. Credit unions would be wise to get ahead of possible deteriorating asset quality by using lessons learned during the Great Recession to inform their path forward.
DELINQUENT LOANS
FOR U.S. CREDIT UNIONS | DATA AS OF 06.30.20
SOURCE: Callahan & Associates
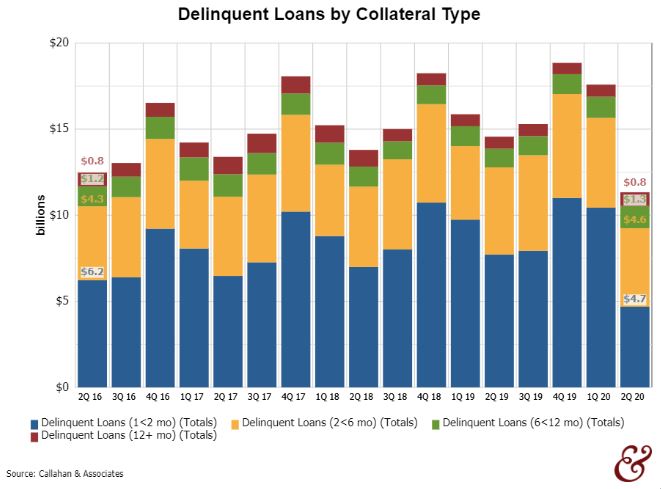
Asset quality has improved over the past year; however, credit unions should continue to monitor this metric as long as pandemic-related restrictions are in effect and unemployment remains high.
No. 2: PPP And Mortgage Sales Lift Earnings but they are unlikely to have a long-term effect on non-interest income.
Gains on PPP loans and mortgage sales to the secondary market have contributed greatly to credit union earnings this year. Performance here has partially made up for the operating income lost as consumer spending slowed and interchange income from debit and credit card usage dropped. First mortgage sales to the secondary market increased 121.3% from June 30, 2019, accompanying a 94.0% jump in first mortgage originations. Secondary market sales reached $51.7 billion or, 39.8% of the $130.0 billion total in mortgage originations through June 30. That’s an increase of 4.9 percentage points from the year prior.
Mortgage production has been the catalyst for loan growth during the past year. However, experts predict it will slow, making supplemental income from secondary sales a one-time benefit. The Mortgage Bankers Association (MBA) forecasts first mortgage originations across all financial institutions will total $638.0 billion in the second quarter of 2021 a potential 31.3% annual decrease from originations between March 31 and June 30, 2020. This is a considerable difference compared to the 85.2% growth from June 30, 2019, to June 30, 2020.
To maintain strong growth in lending, credit unions must continue to open other lending pipelines, particularly in consumer products, as the economy recovers from the COVID-19 pandemic.
ORIGINATIONS AND SALES TO THE SECONDARY MARKET
FOR U.S. CREDIT UNIONS | DATA AS OF 06.30.20
SOURCE: Callahan & Associates
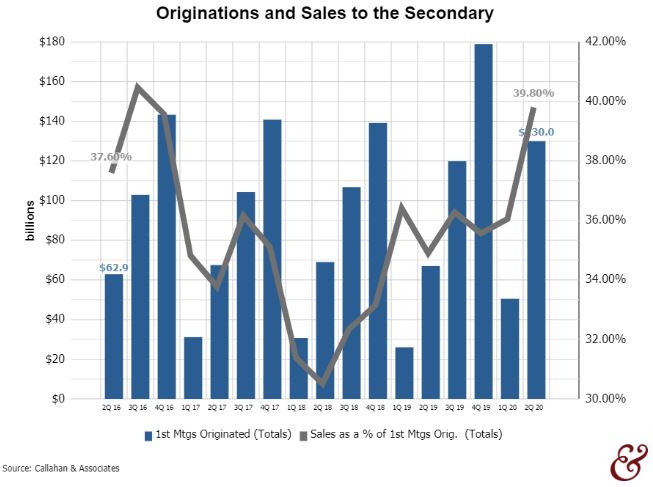
Sales to the secondary market as a percentage of mortgage originations increased 4.9 percentage points during the past 12 months, hitting 39.8% at midyear.
No. 3: Troubled Debt Restructured Loans Are Low but past performance suggest they will climb higher.
Member relief programs, such as deferrals on loan payments, implemented in the wake of the pandemic have contributed to a decline in loan balances reported as total troubled debt restructured (TDR). As of June 30, 2020, TDR loans totaled $7.8 billion that’s a 10.0% decrease from the year prior and the lowest amount since March 31, 2011. Additionally, the total number of TDR loans approved year-to-date declined 40.7% from June 30, 2019.
In the past, credit unions have willingly restructured loan conditions to help members pay their loans and ease the pressure of a borrower’s financial difficulties. In the second quarter of 2020, 0.68% of total loans were TDRs. Comparatively, in the second quarter of 2009, 0.63% of total loans were TDRs. The percentage of TDR loans to total loans increased in the years following the Great Recession until it peaked at 1.76% in 2013.
Today, credit unions are once again deploying programs to assist members during financially difficult times. This should hold true looking forward to 2021.
OUTSTANDING TDR LOANS AND GROWTH
FOR U.S. CREDIT UNIONS | DATA AS OF 06.30.20
SOURCE: Callahan & Associates
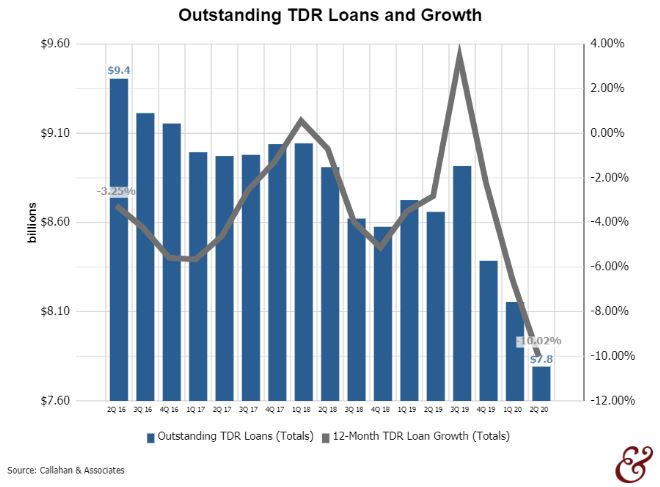
At $7.8 billion, TDR loans are at a near historical low. TDRs reached their lowest total, $7.7 billion, in the first quarter of 2011.