Top-Level Takeaways
-
Consumers financed more than one in five auto loans nationwide through a credit union. Among credit union members, 21.1% held an auto loan tied to their cooperative.
-
Growth in the indirect lending slowed in the third quarter but still outpaced growth in total auto loans.
-
The average auto loan balance increased; delinquency remained steady.
Auto lending at U.S. credit unions was relatively robust in the third quarter despite rising interest rates and slowing growth in the loan portfolio.
Up 10.8% annually, total auto lending expanded $35.8 billion over the year to $365.3 billion as of Sept. 30, 2018. This is the sixth consecutive year of double-digit growth in the third quarter. Total auto loan balances at credit unions have more than doubled since the third quarter of 2012, and auto lending continues to be strong despite growth slowing and interest rates rising in the overall loan portfolio.
Credit union auto market share has grown 5.9 percentage points in the past five years to 20.6% as of Sept. 30, 2018. With the largest market share of any major loan product, auto loans are essential to balance sheet growth at credit unions.
ContentMiddleAd
Growth in indirect lending continued its three-year decline and was down 3.8 percentage points year-over-year to 15.5%. Still, the financing option remains a major origination pipeline for credit union auto loans. Growth in indirect lending has outpaced total auto lending growth for the past seven years.
Although the average auto loan balance is on the rise, credit unions have effectively managed delinquency. New auto loans have the lowest delinquency 0.39% of any lending product at the nation’s member-owned financial cooperatives, and total auto delinquency decreased 5 basis points over the year to 0.60% as of Sept. 30.
Strong vehicle sales in 2018 underpinned performance in the credit union loan portfolio. The National Automobile Dealers Association projects 2018 will be the fourth straight year of more than 17 million unit sales nationwide and is forecasting 16.8 million unit sales in 2019. However, amid a rise in new car prices, consumer demand is shifting from new cars to used ones.
A rise in off-lease used cars and lightly used vehicles are combining to increase the supply of used cars and depress their prices. Elsewhere, SUVs continue to grow in popularity, and some major automakers are refocusing their product line. Ford, for example, has announced plans to stop manufacturing sedans and coupes, except for the Mustang, and produce only SUVs and trucks in North America.
Click the tabs below to view graphs.
TOTAL AUTO LOANS
TOTAL AUTO LOANS
DATA AS OF 09.30.18
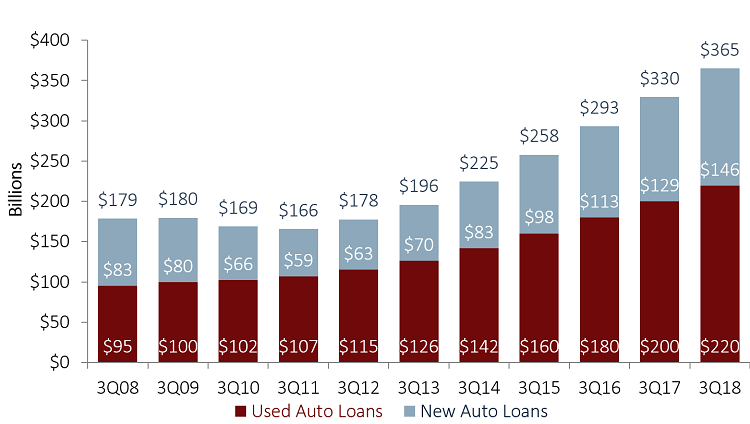
The credit union auto lending portfolio has doubled in the past six years, from $177.7 billion in the third quarter of 2012 to $365.3 billion in the third quarter of 2018.
Source: Callahan & Associates.
CREDIT UNION MARKET SHARE
CREDIT UNION MARKET SHARE
DATA AS OF 09.30.18
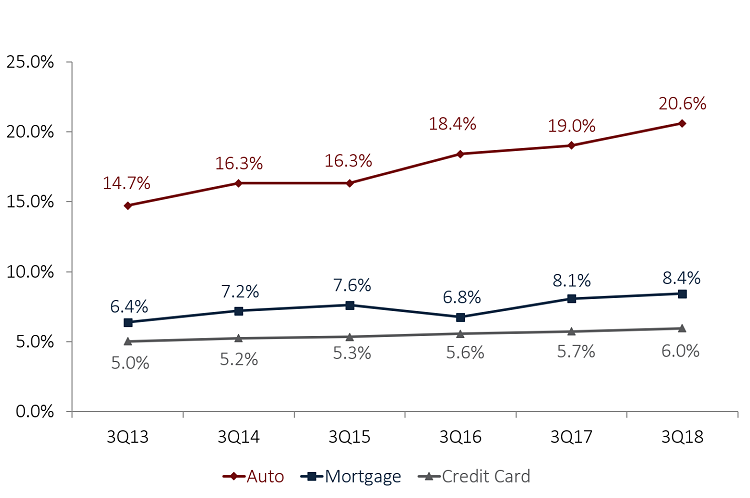
The industry’s market share in the three major loan categories auto, mortgage, credit cards all rose in the past year. Credit unions now claim more than one-fifth of all U.S. auto loans.
Source: Experian Automotive | Mortgage Bankers Association | Federal Reserve.
PENETRATION RATES
PENETRATION RATES
DATA AS OF 09.30.18
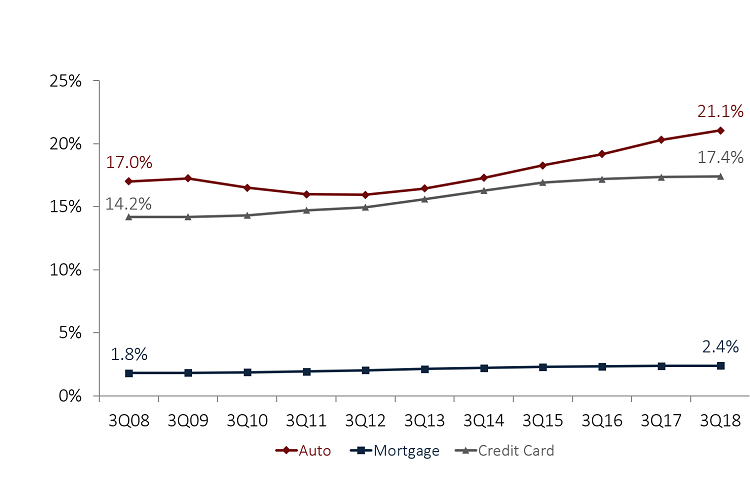
More than one-fifth of all members held a credit union auto loan as of the third quarter. This continues a steady rise in penetration that began in 2012.
Source: Callahan & Associates.
TOTAL INDIRECT BALANCES AND SHARE OF AUTO PORTFOLIO
TOTAL INDIRECT BALANCES AND SHARE OF AUTO PORTFOLIO
DATA AS OF 09.30.18
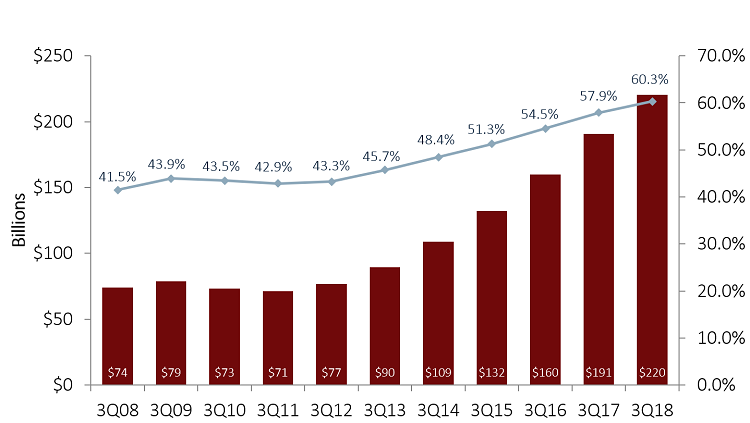
Indirect loan balances grew 15.5% year-over-year in the third quarter of 2018. That’s a deceleration of 3.8 percentage points from the third quarter of 2017.
Source: Callahan & Associates | Mortgage Bankers Association.
AUTO LOAN DELINQUENCY
AUTO LOAN DELINQUENCY
DATA AS OF 09.30.18
The delinquency rate for new auto loans among America’s credit unions is consistently one of the lowest rates of any loan product.
Source: Callahan & Associates.
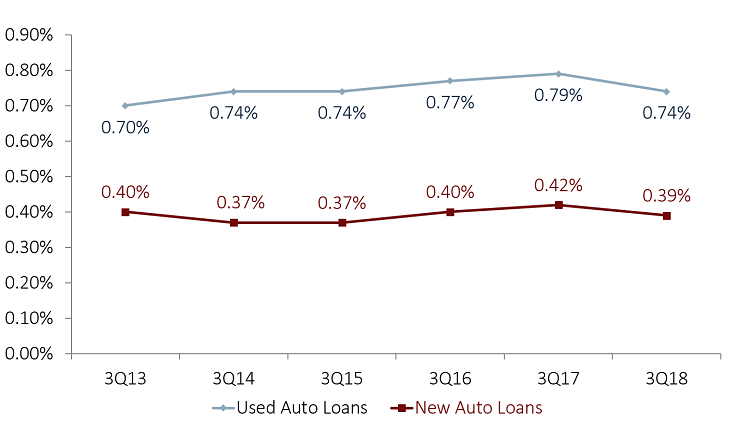
DELINQUENCY BY LOAN TYPE
DELINQUENCY BY LOAN TYPE
DATA AS OF 09.30.18

The overall delinquency rate for auto loans at U.S. credit unions has remained steady over the past five years, alleviating fears of a potential auto bubble.
Source: Callahan & Associates.
Driving Into The Data
Total auto loan balances at credit unions expanded 10.8% over the year to $365.8 billion. New auto loans expanded 12.5% year-over-year to $145.5 billion, and used auto loans grew 9.8% to $219.7 million. The total number of auto loans extended by credit unions increased 8.3% or 1.9 million to 24.6 million as of Sept. 30, 2018.
Altogether, auto loans comprised 35.2% of the total loan portfolio in the third quarter. With the number of vehicle loans growing at a slower pace than vehicle loan balances, the average auto loan balance for the industry increased, moving up 2.4% year-over-year to $14,856 as of the third quarter.
Auto lending represents an area in which credit unions closely compete with other financial institutions, and consumers financed more than one in five auto loans nationwide through a credit union as of the third quarter. Auto market share for the industry was up 1.6 percentage points versus last year and 5.9 percentage points versus five years ago.
Among credit union members, 21.1% held an auto loan tied to their cooperative as of Sept. 30, 2018. That’s an increase of 76 basis points. Auto loan penetration is by far the highest penetration rate of any major loan product.
Indirect Lending
Indirect lending presents a major funnel for auto lending at U.S. credit unions, although there’s been some tightening as of late. Up 15.5% year-over-year to $220.4 billion, indirect balances accounted for 60.3% of the total auto lending portfolio. That growth was 3.8 percentage points slower than last year, however, and growth in the indirect lending has decreased in the third quarter for each of the past three years. Still, the indirect channel remains strong. The annual growth in this channel has outpaced annual growth in the auto loan portfolio, and the share of indirect loans in the auto portfolio has increased since 2011.
The slowdown in growth can in part be attributed to tightening margins. Generally, auto rates move slower than interest rate hikes in the overall market. The competition that credit unions face from other financial institutions in the auto lending space naturally puts downward pressure on rising rates and tightens the profitability of the loan. In instances where there is additional dealer compensation, credit union margins are further reduced.
That dynamic along with absorbing all interest rate, funding, and credit risk makes the indirect channel an increasing challenge for some credit unions. Additionally, it is difficult to develop a relationship with the member that extends beyond the auto loan.
Indirect loan delinquency decreased 5 basis points annually to 0.61%. This is in line with the overall auto loan portfolio, in which delinquency decreasd 5 basis points year-over-year to 0.60% as of the third quarter.
Auto delinquency at credit unions has remained within a range of 10 basis points since the 5300 Call Report began breaking out the metric in 2013. Overall, used auto loan delinquency was down 5 basis points to 0.74%, and new auto loan delinquency dropped 3 basis points over the year to 0.39%. New auto loans, in fact, performed better in terms of delinquency than any often major product in the credit union loan portfolio.
Looking For Answers About Your Auto Portfolio?
It takes minutes to compare various aspects of your auto lending portfolio to other credit unions with Peer-to-Peer. Let us walk you through the numbers with a custom performance audit.
