Diminished housing supply, rising home prices, and new regulations couldn’t keep credit unions from bulking up their real estate loan portfolio, according to first quarter performance data now available from Callahan Associates.
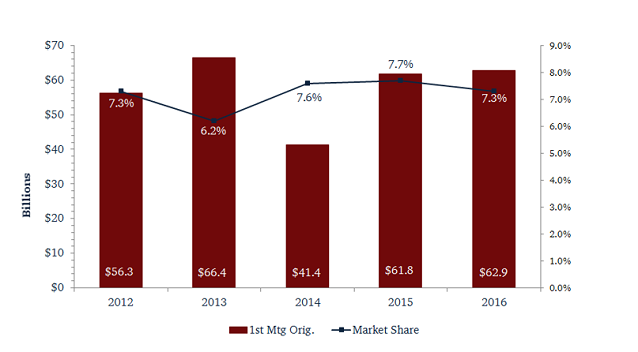
First mortgage originations reached $26.7 billion for the credit union industry. That’s a 2.1% increase year-over-year. Credit unions’ share of U.S. first mortgage originations, however, dipped slightly to 7.6% at the end of the first quarter. Elsewhere in the portfolio, credit unions posted 19.8% origination growth in other real estate loans and lines of credit a net increase of $6.1 billion.
YEAR-OVER-YEAR FIRST MORTGAGE ORIGINATIONS
For all FirstLook credit unions | Data as of 03.31.16
Callahan Associates | www.creditunions.com
Source: Peer-to-Peer Analytics by Callahan Associates
Notable for risk-averse credit unions, continued strong growth in real estate originations has not dampened the industry’s asset quality. The first mortgage delinquency ratio hit 0.59% at the end of the first quarter; that’s an 11-basis-point drop from the year prior. Delinquency for other real estate also posted a year-over-year drop of eight basis points and dipped to 0.65% to close out the first quarter.
Real Estate Takes Half The Cake
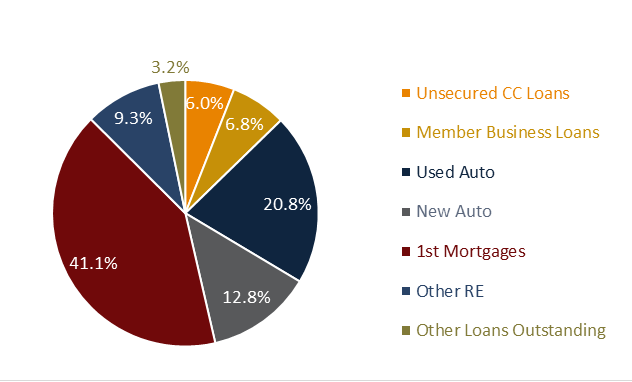
Together, first mortgages and other real estate accounted for more than half of the credit union loan portfolio and totaled $408.0 billion in loans outstanding, more than any other segment.
Despite the strong presence of real estate first mortgages accounted for 41.1% and other real estate 9.3% its share of the credit union loan portfolio is down 70 basis points from first quarter 2015. The drop mirrors the rise of the auto segment, which posted a 100-basis-point increase.
CREDIT UNION LOAN PORTFOLIO
For all FirstLook credit unions | Data as of 03.31.16
Callahan Associates | www.creditunions.com
Source: Peer-to-Peer Analytics by Callahan Associates
State Of The States
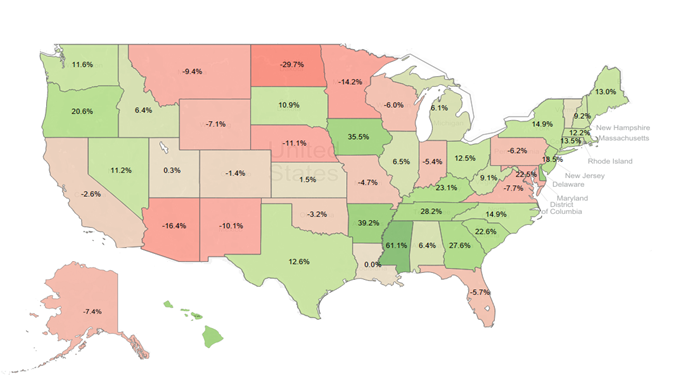
Most states posted positive growth in first mortgage originations. Credit unions in the Northeast, Southeast, and Northwest corridors posted the highest overall growth, as denoted by the dark green shading in the U.S. map below.
The clear first quarter leader in mortgage originations was Mississippi. Credit unions in the Magnolia State collectively posted a 61.1% year-over-year positive change.
On the other end of the scale, credit unions in North Dakota, a state wrestling with the collapse of its oil industry, posted a 29.7% decline in originations.
YEAR-OVER-YEAR FIRST MORTGAGE ORIGINATION GROWTH
For all U.S. credit unions | Data as of 03.31.16
Callahan Associates | www.creditunions.com
Source: Peer-to-Peer Analytics by Callahan Associates
Growth in mortgage originations can result from a variety of factors. Economic trends, such as rising costs of rents in cities nationwide and historically low interest rates set by the Federal Reserve, are pushing demand for housing inventory. As members increasingly look to credit unions for their mortgage needs, expect to see more depth and breadth of real estate lending shine in the numbers.