
Hover over image to enlarge
LENDING
Members secure $14 billion in funding so far this year.
Consumer products such as auto loans, student loans, and credit cards were the core driver of credit union lending in the first half of 2014. In all, credit unions granted over 15% more consumer loans in the first half of 2014 than in the same period in 2013, equaling an additional $14 billion leveraged by consumers for important life events such as purchasing a vehicle or attending college.
Balances in every loan category grew faster in the first six months of this year than they did at midyear 2013, with the fastest growing of those being new auto loans, up 16.9% from June 2013 levels. Additionally, three other types of loans grew balances by double digits over the same timeframe: first mortgages (10.0%), used auto (11.5%), and member business loans (13.1%).
With economic indicators pointing towards a strengthening economy, members have been spending more and saving less. This shift has culminated in midyear loan growth that outpaces share growth threefold and dominates last year’s loan growth numbers, at 9.8% versus 3.4% in the first half of 2013.
3x
Loans are growing nearly three times faster annually than shares as of June 2014.

Hover over image to enlarge
AUTO LENDING
Credit unions gain growing influence where the rubber meets the road.
Car sales are ramping up amid an improving economy and low loan rates. According to the Federal Reserve Bank of New York, U.S. auto loan originations are at the highest level in eight years and auto loan balances have also increased for the thirteenth consecutive quarter. Following this national trend, the credit union auto loan portfolio grew by $25.5 billion or 13.4% over the past year to reach a total of $214.9 billion as of June 2014. This marks the highest 12‐month auto loan growth rate achieved since March 2003.
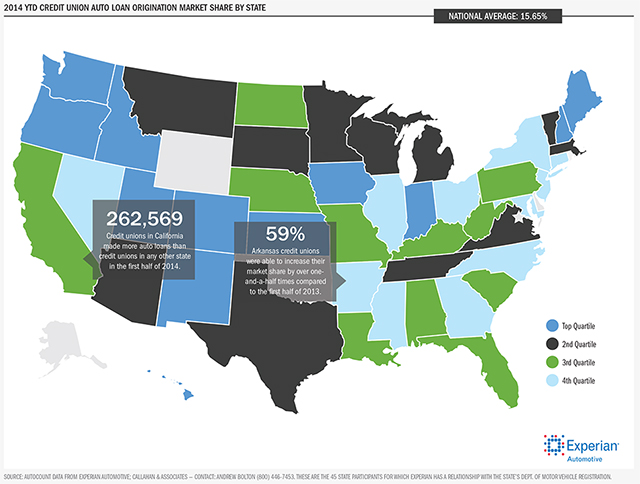
According to Experian Automotive, credit unions have also increased their national share of auto loan originations to 15.7% in the first half of 2014, up from 14.5% for the same period the year prior. New auto loans were the fastest growing segment of the loan portfolio as of June 2014, up 16.9% over the past year to top $78.3 billion. Used auto loans also posted strong growth to reach $136.6 billion, up 11.5% over the previous June, yet this marks the seventh consecutive quarter in which annual new auto growth has exceeded that of used autos.
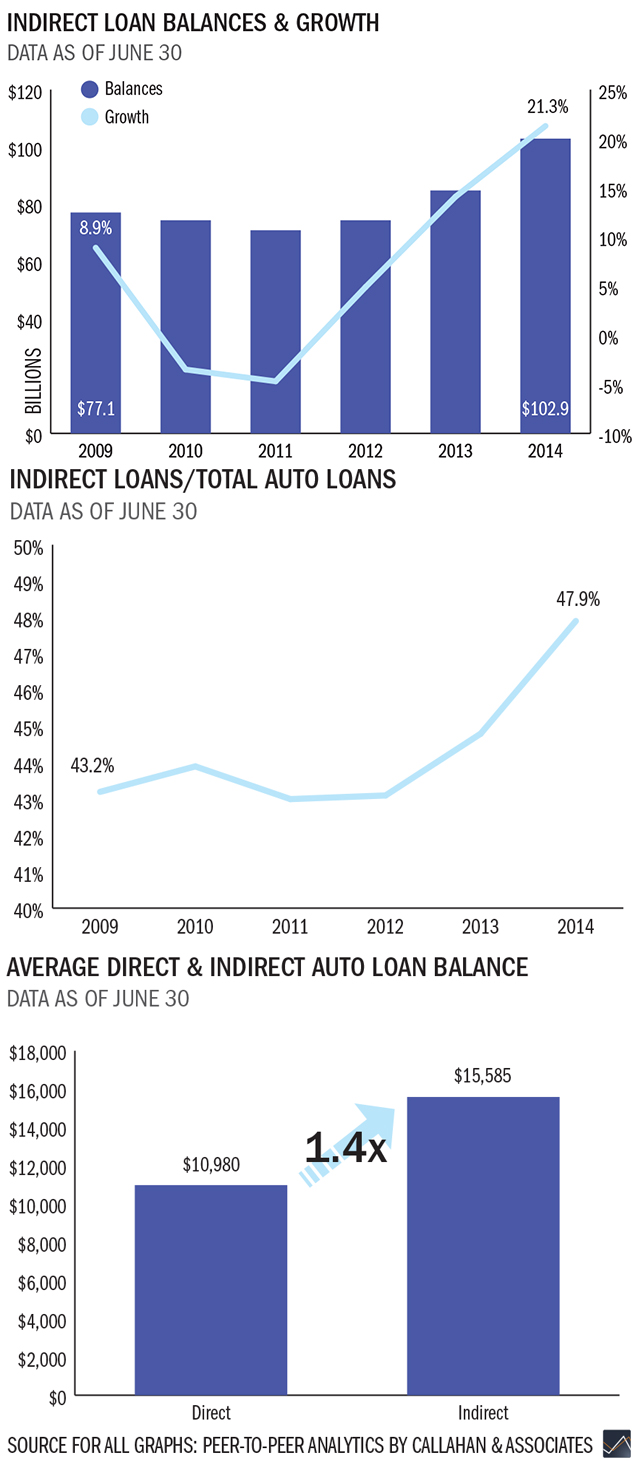
Indirect lending has been another key driver of success here for many credit unions. As of mid-year 2014, indirect auto loan balances were up 21.3% from a year prior versus an increase in direct loans of just 7.1%. Indirect auto loans also accounted for 47.9% of total auto loan balances as of June, up from 44.8% a year prior.
0.56%
At 0.56%, auto loans have the lowest delinquency rate for all loan products as of June 2014.
2013: 14.5% vs. 2014: 15.7%
The industry’s market share for auto loan originations is up 1.2 percentage points from the first six months of 2013.
Source: Autocount data from experian automotive; Peer-To-Peer Analytics by Callahan Associates
Click On Image For Larger Version
Hover over image to enlarge
MORTGAGE LENDING
Credit unions nearly double their market share in less than five years.
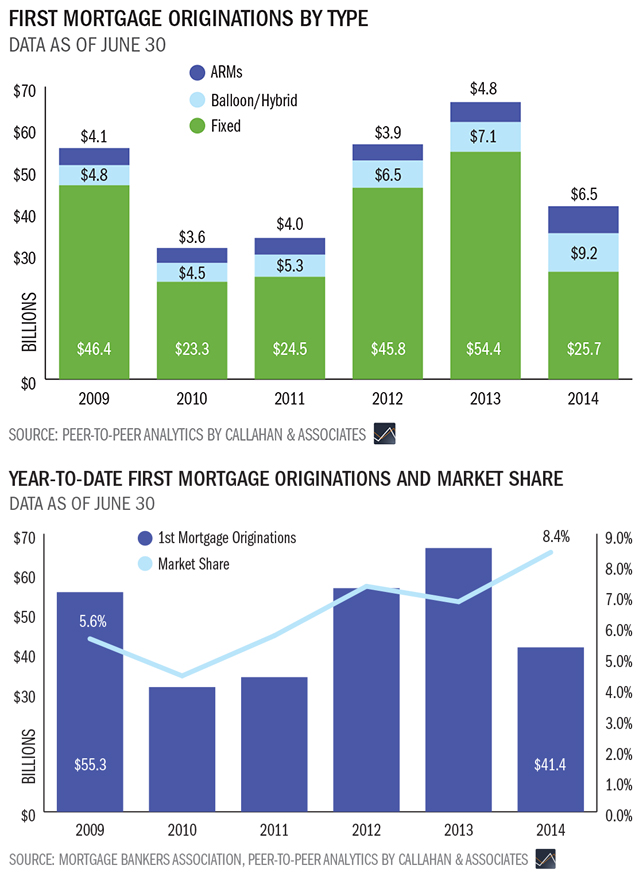
The $41.4 billion in mortgage originations generated through June 2014 is significantly less than the $66.4 billion seen in the first half of 2013, an annual reduction of 37.6%. In spite of this decline, outstanding first mortgages actually grew 10% annually to reach to $283.3 billion, much faster than 5.7% growth experienced a year ago.
Credit unions’ market share in mortgage originations has been rising as other lenders pull back from this market. In fact, credit unions accounted for 8.4% of the $493 billion in total mortgage originations in the United States through the first six months of 2014, according to the Mortgage Bankers Association. This is a major improvement from the 6.8% seen one year prior and nearly double the 4.4% market share seen back in June 2010.
Credit unions have also originated more adjustable rate and hybrid mortgages so far in 2014, at 38% of first mortgage originations compared to as little as 16% back in 2009. The lower rates offered by these loans are a big incentive for many members, including those who might not plan on being in their homes for the full loan term. These products also help credit unions mitigate interest rate risk due to periodic rate adjustments.

Hover over image to enlarge
CREDIT CARDS
The industry shatters multiple records in an important segment of its payments portfolio.
Growing demand coupled with attractive yields made credit cards an increasingly important component of credit unions’ loan portfolios this year. As of June 2014, 56.4% of credit unions offered this plastic payment option to members, up from 55.5% the previous June.
Usage of this payment product also gained momentum as the economy recovered and the percentage of credit cards to total loans has risen more than a percentage point over the past decade to reach 6.4%.
The average credit card balance for the industry stood at $2,702 as of midyear, slightly higher than in June 2013. Total credit card balances also topped $43.3 billion a 8.4% rise over June 2013 levels and the highest annual growth for this metric since the recession began.
According to the Federal Reserve, credit unions have even increased their market share of outstanding credit card balances to 5.2% in the second quarter of 2014, up 25 basis points from that period the year before.
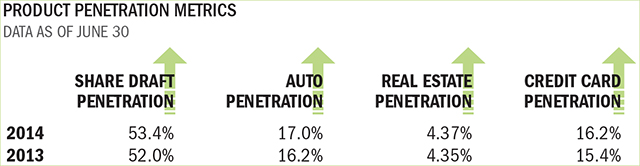
The number of active credit cards was also up 8.0% annually as of June reaching a new high of 16.05 million. Despite strong annual membership growth of 2.9%, growth in the number of active credit cards still outpaced this activity, causing card penetration to hit an all-time high of 16.2% in June 2014.
6.4%
Credit card loans comprise 6.4% of the total loan portfolio at credit unions as of June 2014.
Source: Peer-to-Peer Analytics by Callahan & Associates.
2013: 15.4% vs. 2014: 16.2%
More members are taking advantage of credit card offerings at credit unions, leading to a higher penetration rate compared to June 2013.
Source: Peer-to-Peer Analytics by Callahan Associates.
Hover over image to enlarge
SHARES
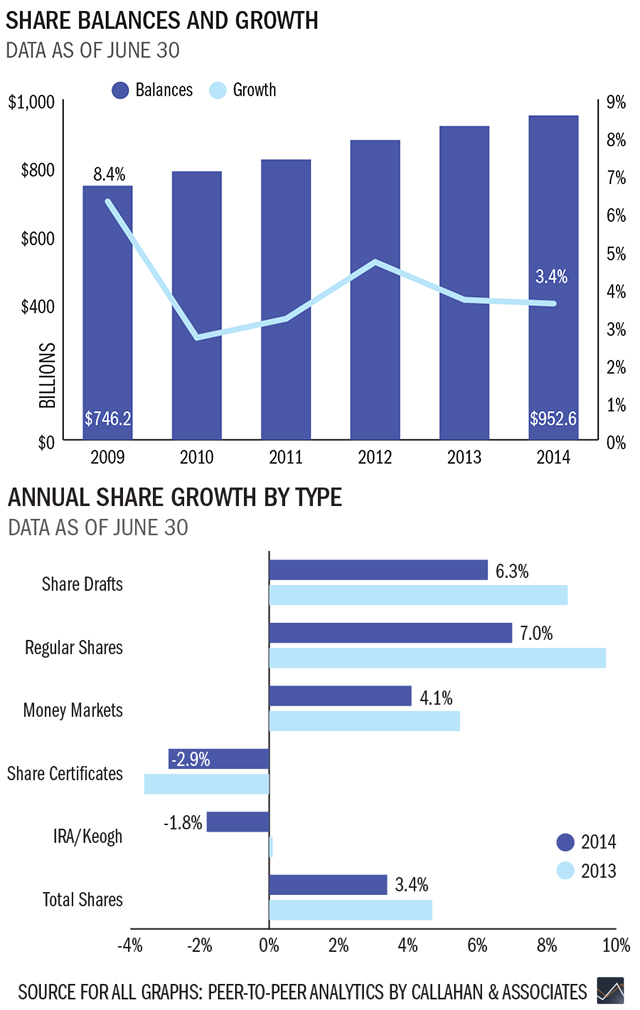
Consumers’ recession-influenced rush to savings options finally slows.
2.76 million
The increase in the number of share draft accounts at credit unions between June 2013 and June 2014.

Hover over image to enlarge
MEMBER BUSINESS LOANS
Growing expertise puts credit unions on track to fund almost 90,000 small businesses this year.
$188,668
The average dollar amount for member business loans granted to members during the first half of 2014.
Hover over image to enlarge
INVESTMENTS
Maintaining liquidity allows credit unions to meet current needs while prepping for future demand.
As of midyear 2014, credit unions continued to remain liquid in an effort to fully meet surging consumer loan demand.
Total investments declined from the $404.6 million seen one year prior to just $387.1 million this quarter, a 3.8% reduction driven largely by the 4.5% increase seen in total loans over the same time. This development follows the usual seasonal pattern of higher balances in the first quarter followed by a drop in the second and third quarter.
Despite this drop in activity, the average yield on investments has been steadily increasing over the past year. Since June 2013, the overall yield has risen from 1.07% to 1.22%, stemming from a combination of factors including lower cash balances and new purchases of higher yielding securities.
Federal agency securities still account for 50% of the investment portfolio, with both federal agency debt instruments and federal agency mortgage-backed securities remaining the primary investment options. Cash has declined at both corporate credit unions and other financial institutions as of midyear.
Looking forward, investment portfolios will likely remain short in an effort to both fund new loans and purchase new securities when rates eventually rise.
MEMBER RELATIONSHIPS
Modern, meaningful offerings convince members to move more of their financial lives over to a cooperative.
Increasing loan balances at credit unions have pushed up the average member relationship nationwide. For example, the average member had $16,004 in combined loan and deposit balances as of June 2014, up from 2.8% in June 2013. The average loan balance per member also rose by 6.5% in the past year, further fueling the overall increase in member relationships.
New and used auto loan balances claimed the title of the first and third fastest-growing segments of the loan portfolio respectively.
Penetration rates for share draft accounts, auto loans, credit cards, and real estate loans were also all higher this quarter than at midyear 2013. Auto loan penetration in particular was noticeably up, increasing 71 basis points to 17%.
Graph Source: Peer-To-Peer Analytics by Callahan Associates

Hover over image to enlarge
EARNINGS
A slowdown among non-interest sources fails to stem gains in revenue.
Driven by growth in loan and investment income, total revenue rose 1.1% year-over-year in the second quarter, marking the first time since the second quarter of 2009 in which that has occurred. As of the first half of 2014, total revenue for the industry reached $25.3 billion.
A 3.5% annual increase in total interest income has also helped offset the 4.7% decline in total non-interest income experienced in the first six months of the year.
As loan demand picked up, loan income grew by 2.9% annually, reaching a total of $16.1 billion. Due to this growth, the net interest margin expanded by 5 basis points, marking the second consecutive quarter that this metric has increased year-over-year. Thanks to higher interest rates, investment income also climbed to $2.3 billion through June 2014, at an annual growth rate of 9.0%.
Meanwhile, total non-interest income was down compared to this period a year prior, with fee and other operating income falling 3.7% and 5.6% respectively. Viewed as a percentage of average assets, fee income dropped to 0.65% and other operating income dropped to 0.61%.
The decline in other operating income was partly influenced by reduced mortgage sales to the secondary market as refinancing activity slowed. During the first six months of 2014, credit unions sold just $13.2 billion in first mortgages to the secondary market, down 61.4% from a year ago.
Credit unions have been successfully managing their operating expenses, maintaining a steady ratio of 3.07% over the past three years. The industry’s return on assets was 0.81% through the second quarter of 2014, four basis points below second quarter 2013 figures but also three basis points higher than the ROA reported in the first quarter of 2014.
-4.7%
Non-Interest Income Growth
3.5%
Interest Income Growth
Total Revenue Up 1.1%
Hover over image to enlarge
INDIRECT LENDING
A long-standing strategy returns to the spotlight in a key portfolio segment.
An indirect loan is a loan that is underwritten and held by a credit union, but with a third party such as a car dealership helping facilitate the financing arrangement. While a large majority of credit union indirect lending occurs via autos, some financial cooperatives also participate in other types of indirect lending such as mortgages or smaller-dollar consumer loans. Almost 2,000 credit unions or 30% of the industry currently participates in indirect lending of some type.
When compared to the portion of auto loans made directly to members, it’s clear just how big a role indirect has played in the success of this portfolio segment. As of June 2014, indirect auto loan balances have increased $18.0 billion annually, compared to an increase of just $7.4 billion for direct auto loan balances over the same period.
The average balance for indirect auto loans was also $15,585 at midyear, nearly one and a half times the average balance for direct auto loans at $10,980.
The chance to acquire new members is another component of indirect lending that makes it attractive to credit unions. According to data from CU Direct, an indirect auto lending CUSO, 63.7% of indirect auto loans go to individuals who were not previously members of the issuing credit union.
While this strategy may not be a fit for every institution, it has consistently proven itself to be a valuable tool in the industry’s tool belt.
63.7%
The percentage of indirect loans that are also new members for a credit union, according to CU Direct data.