5 Ways To Better Understand Your Auto Portfolio
Use these metrics to better understand what third quarter auto data means to a credit union’s loan portfolio.



Industry leaders share how they approach fintech investment, balancing immediate needs with longer-term bets while keeping member value and mission at the center.

Credit unions that enable seamless movement between fiat and digital assets position themselves as a trusted on- and off-ramp.

The credit unions that win the next generation will be the ones that showed up early, when young members were forming habits and deciding whom to trust.

The challenge is no longer whether to adopt AI, but how to adopt it responsibly with the right governance, the right partners, and the right balance between technology and human oversight.
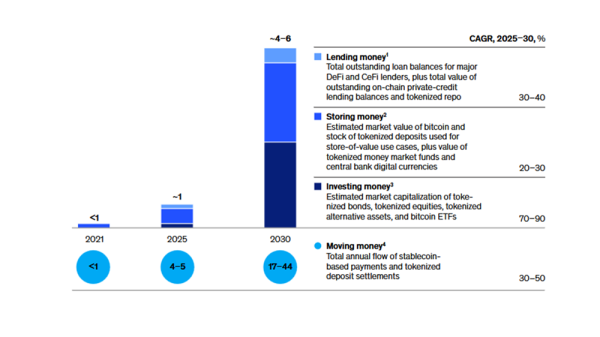
McKinsey projects trillions of dollars in growth across digital assets, with money movement emerging as one of the biggest opportunities.

The Indiana cooperative blends internal development with selective partnerships to meet members’ needs today now while positioning for what’s next.

The San Diego cooperative leans on its CUSO and the CURQL network to make fintech investments, but member needs still guide which solutions ultimately make it into the credit union’s operations.

Hands-on work with artificial intelligence tools is future-proofing staff members, giving them the confidence to adopt new technology and embrace efficiencies.
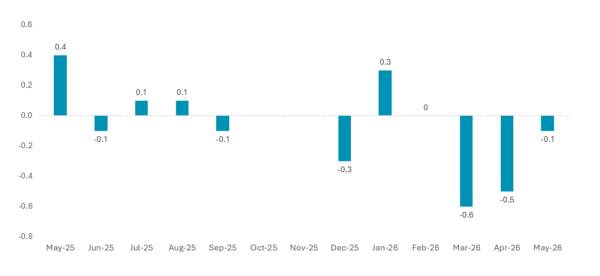
Wages briefly caught up with inflation, but rising costs have pushed them back into negative territory. Here’s what that shift means for member finances and credit union performance.
Suncoast Credit Union balances near-term needs with longer-term bets, applying discipline to timing, valuation, and fit to decide when to invest and when to walk away.