Callahan hosted its quarterly Trendwatch webinar on November 9, 2021, to discuss the most notable trends in the credit union industry. Despite fears of COVID’s Delta variant sparking another round of quarantining and economic slowdown, the industry continued its impressive growth across most metrics with nary a hitch several industry records were sustained while new ones emerged.
Despite balance sheet growth continuing at a tremendous pace, reductions in per-asset expenses have generated record earnings for credit unions. Industry leaders must think on how to best convert this strong financial performance into positive community impact as the country works to recover from the chaos of the pandemic.
Here are three takeaways from Tuesday’s webinar:
1. Both spending and saving are on the rise for credit union members.
Between September 30, 2020, and September 30, 2021, share balances expanded 14.4%. This is down slightly from the 18.2% annual growth reported in the third quarter of last year, which had been buoyed by the three federal stimulus checks and unemployment benefits including the CARES Act. This third quarter’s share balances are now a full year removed from the CARES Act’s impact, so slowing growth is mostly the result of baseline changes. Members are still adding money to their credit union accounts at historically high rates.
Share certificates remain unpopular in the low-rate environment, contracting 13.8% from one year ago and comprising 4 percentage points less of the industry’s outstanding share portfolio. On the other hand, regular shares, share drafts, and money market shares expanded their portfolio concentration, accounting for 113.7% of new deposits over the past year. These checking and savings accounts known as core deposits are liquid and accessible, yet are historically stickier share types. Core members make deposits in these accounts, and these funds are more likely to stick around for the longer term than certificates, which often leave the institution when the product expires.
Loan-To-Share Ratio
For All U.S. Credit Unions | Data As Of 09.30.21

The industry’s loan-to-share ratio hit its highest level in more than a decade in the third quarter of 2019. Since then, an influx of Federal relief drove down the ratio until early in 2021, when record originations and a reduction in early low paydowns pushed the ratio back up.
Source: Callahan & Associates.
Despite continued share growth, loan demand has picked up to the point that credit unions are able to lend nearly as fast as the dollars are deposited an uncommon dynamic throughout the pandemic. Year-to-date loan originations the dollar amount of loans granted since the start of the year experienced 19.2% growth annually, fueled by 23.2% annual growth in consumer lending. This is the second consecutive quarter since in which consumer origination growth outpaced growth in first mortgage originations, though mortgage volume remains at all time highs.
Record loan originations have been a theme for a while, but these new loans are finally starting to stick on balance sheets. Outstanding loan balances expanded 5.8% year-over-year. Although annual loan growth did not reach the same level of growth as share balances, loans outpaced shares on a quarterly basis: 2.5% to 2.0% respectively. As a result, the loan-to-share ratio is down 5.7 percentage points year-over-year, but up 30 basis points since June to 69.9%. This is the second consecutive quarter that the loan-to-share ratio increased, having been on the decline since the tail-end of 2019. Throughout the pandemic, members used large portions of Federal Relief to pay down debt early. With no additional Federal relief since March, these early paydowns have slowed, allowing credit unions to more effectively allocate their asset portfolio into productive loans.
This is the second consecutive quarter the loan-to-share ratio increased, having been on the decline since the tail-end of 2019. Throughout the pandemic, members used large portions of Federal relief to pay down debt. With no additional Federal relief since March, these early paydowns have slowed, allowing credit unions to more effectively allocate their asset portfolio into productive loans.
2. Asset quality continues to improve, reaching a historic low.
The asset quality ratio improved again across the third quarter of 2021, reaching a new record low.
Total loan delinquency remained flat from second quarter at 0.46%, the lowest delinquency ratio on record. Of the major loan types, first mortgage delinquency had the greatest improvement on a quarterly basis down 4 basis points to 0.41%. Annually, used auto delinquency improved the most, shrinking from 0.51% to 0.40%. Similarly, net charge-offs have reached a record low of 0.26% of loans. This is down two basis points quarterly and 22 basis points over the past 12 months. Together, the third quarter ended with an asset quality ratio the percent of outstanding loans that are delinquent or charged-off of 0.72%, down 31 basis points from one year ago.
Asset Quality
For All U.S. Credit Unions | Data As Of 09.30.21
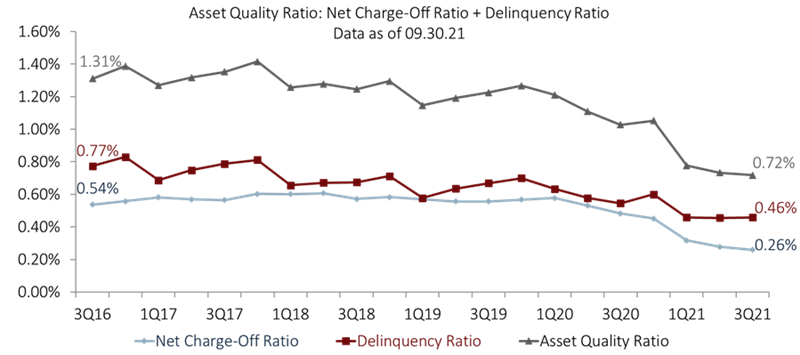
Record-low delinquency and net charge-off ratios show asset quality remains strong despite the lack of new federal relief to support loan payments.
Source: Callahan & Associates.
Credit unions nationwide increased their allowance for loan and lease losses accounts at the beginning of the pandemic, yet asset quality is strong and higher default trends have yet to materialize. As a result, credit unions are slowing contributions to their allocation for loan and lease loss accounts this year. Year-to-date provisions contracted 86.8% year-over year, with less than $1 billion total in additions to coverage. Despite a net decline in the industry’s aggregate allowance account for the second straight quarter, the coverage ratio remained nearly double the historical average at 204.6%. For every dollar current delinquent, credit unions have the designated savings available to cover it more than twice over.
Despite a net decline in the industry’s aggregate allowance account for the second straight quarter, the coverage ratio remained nearly double the historical average at 204.6%. For every dollar current delinquent, credit unions have the designated savings available to cover it more than twice over.
3. Earnings are up as credit unions focus on controlling expenses
Return on assets remains at record highs, up 46 basis points year-over-year to 1.11%. The greatest contributor to these high earnings is controlled expense growth. Work-from-home options, limited travel expense, and a surge of low-maintenance cash assets all helped to drive the operating expense ratio down to 2.80%.
Prolonged high asset quality has minimized fears of defaults, allowing credit unions to redirect provision funds into capital growth. Credit unions are spending less to manage each dollar of assets under management, and these cost controls more than make up for the fact that core interest earnings have slowed as spreads remain tight.
Earnings Model
For All U.S. Credit Unions | Data As Of 09.30.21
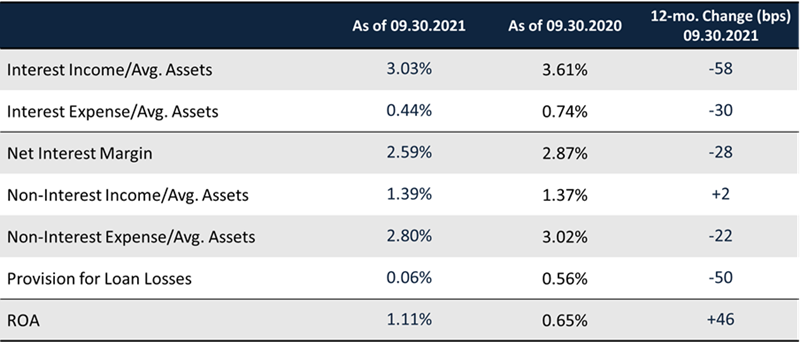
Expense control bolstered a second quarter of a record-high return on assets ratio.
Source: Callahan & Associates.
Net worth balances are up 10.8% annually, which was surpassed by 13.0% asset growth, causing the net worth ratio to decline 20 basis points annually to 10.2%. So far this year, however, credit unions experienced record earnings, and this key capitalization ratio has risen 22 basis points since March.
Stable capitalization and an overall healthy industry have given credit unions the opportunity to devote more of their resources to positively impact both members and their communities. Be it investing in staff or new technology-focused delivery channels, credit unions have room to take strategic risks and invest in additional operational efficiency.
Net Interest Margin Vs. Operating Expense Ratio
For All U.S. Credit Unions | Data As Of 09.30.21
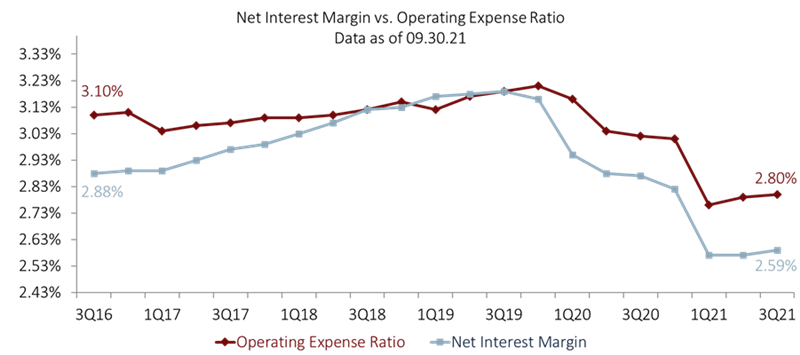
The net interest margin and the operating expense ratio have moved in lockstep for the past 18 months, yet earnings have grown to record highs. How can credit unions use these earnings to benefit their membership and promote growth?
Source: Callahan & Associates.
Technology is certainly one way to invest in your members, and COVID accelerated that development, says William Hunt, Callahan’s senior industry analyst. Still even new technology delivery channels are table stakes. Almost no one at this point is going to make a decision to join an institution because they have a mobile app or an online website. Credit unions can’t just make an impact, they have to let members know they are being purposeful and are helping financial lives as well as the community as a whole.