The lending market has shifted, and loan originations have significantly slowed year-over-year. Marked by rising interest rates, 2023 represented a return to historic lending norms in dollar value following years of elevated output.
YEAR-TO-DATE LOAN ORIGINATIONS AND ANNUAL GROWTH
FOR U.S. CREDIT UNIONS | DATA AS OF 12.31.23
© Callahan & Associates | CreditUnions.com

- Loan originations dropped 28.4% annually to $545 billion as of Dec. 31. Although this is in line with historic dollar amounts, relative to assets, originations are far lower than they were before the pandemic. Credit unions are struggling to put loans into the hands of would-be borrowers.
- Thanks to the rising interest rates and homes prices, real estate originations declined 36.4% year-over-year. In 1-to-4 family residential first mortgages, credit union originations fell approximately 43% year-over-year. This greatly exceeds the total marketplace decline of 27% as reported by the Mortgage Bankers Association.
- After years of a hot indirect market, tighter liquidity has pushed credit unions to pull back on indirect lending. Consequently, non-real estate originations dropped 23.2% in 2023.
LOAN GROWTH, MEAN VS. MEDIAN
FOR U.S. CREDIT UNIONS | DATA AS OF 12.31.23
© Callahan & Associates | CreditUnions.com
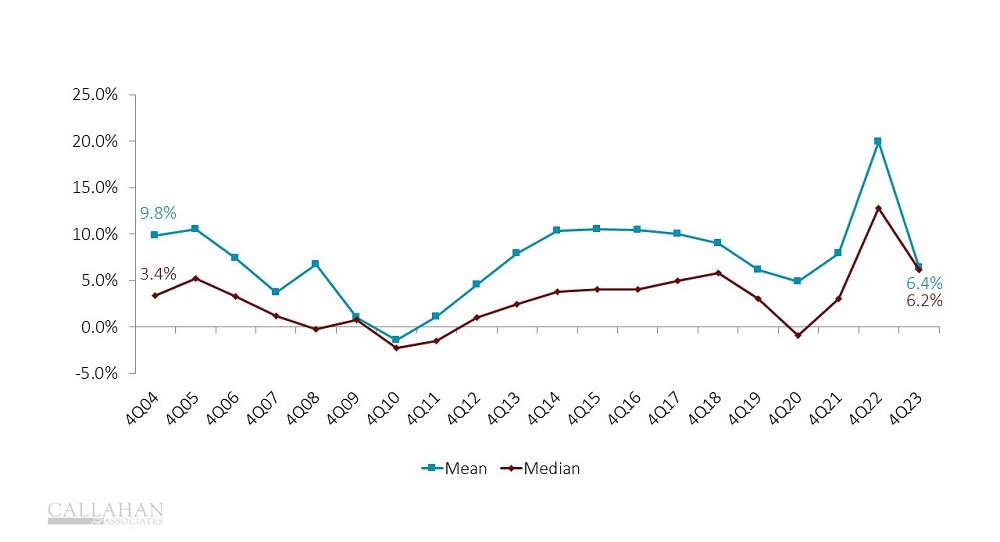
- In 2023, annual credit union loan growth was 6.4%, similar to pre-pandemic levels. This is mainly the result of a slowdown both in loan originations and paydowns. Paydowns dropped $50 billion year-over-year to $427 billion. There is a possible link between this and the rise in delinquency observed throughout 2023.
- Notably, the median credit union’s loan growth is converging with the industry average. The liquidity position at smaller credit unions is such that they can continue lending, whereas larger credit unions have pulled back. As a result, small credit unions are adding higher yielding loans to their balance sheet.
ASSET QUALITY BREAKDOWN
FOR U.S. CREDIT UNIONS | DATA AS OF 12.31.23
© Callahan & Associates | CreditUnions.com
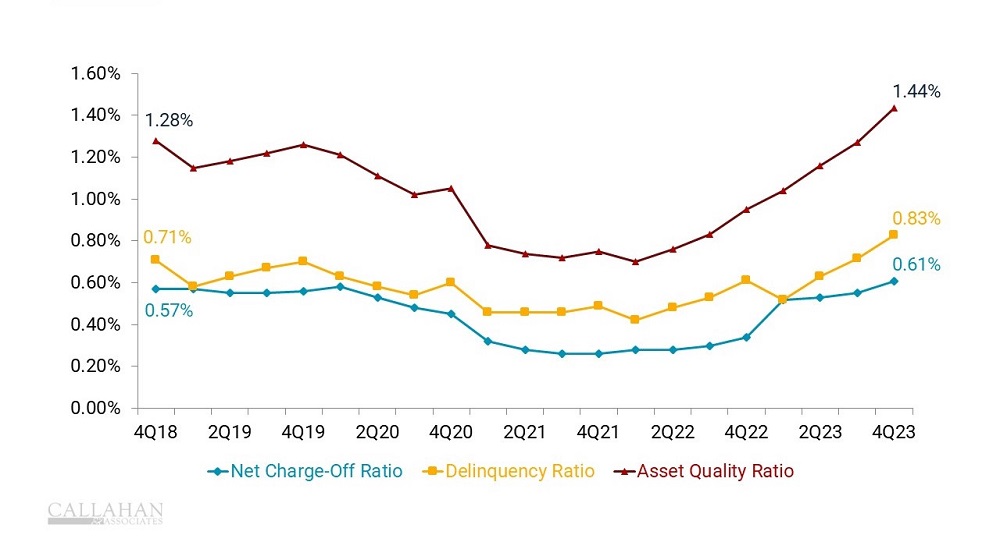
- Delinquency remained a focal point throughout 2023, particularly as consumer budgets tightened in the face of inflationary pressures. For the fourth consecutive quarter, delinquency ticked up and reached 0.83% at year-end. However, delinquency rates have varied significantly across different lending categories. Notably, credit card and auto loans surpassed the overall delinquency rate at 2.11% and 0.90%, respectively.
- Bolstering loan loss provisions helps credit unions prepare for downturns in borrower repayment and mitigates the risk of further delinquency. So far, that’s exactly what cooperatives have done. Loan loss provisions accounted for 0.51% of average assets as of Dec. 31, double what it was last year.
- Looking ahead, anticipated rate cuts in the first half of the year might herald the next shift in lending. Such cuts could stimulate lending activity and reignite consumer interest in borrowing. In the interim, it’s worth noting that current delinquency levels are still below historic highs. Credit unions are exercising due diligence in addressing this issue and effectively providing for it.
Credit union performance data for this article comes from Callahan’s quarterly Trendwatch webinar, which includes Call Report data from 99% of all industry assets. Watch Trendwatch 2023 today on-demand.