Read the full analysis or skip to the section you want to read by clicking on the links below.
| LENDING | AUTO LENDING | AUTO MARKET SHARE MAP |
| MORTGAGE LENDING | CREDIT CARDS | SHARES |
| MEMBER BUSINESS LENDING | INVESTMENTS | MEMBER RELATIONSHIPS |
| EARNINGS | SPECIAL SECTION: ASSET QUALITY |
Lending
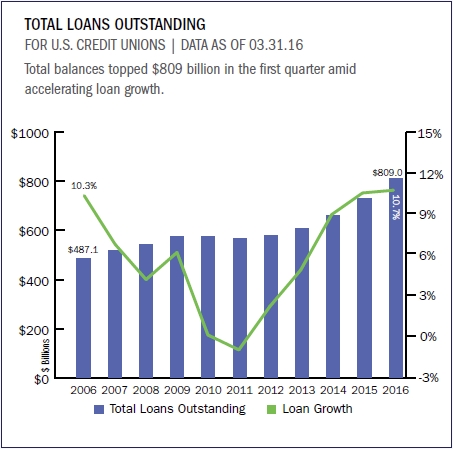
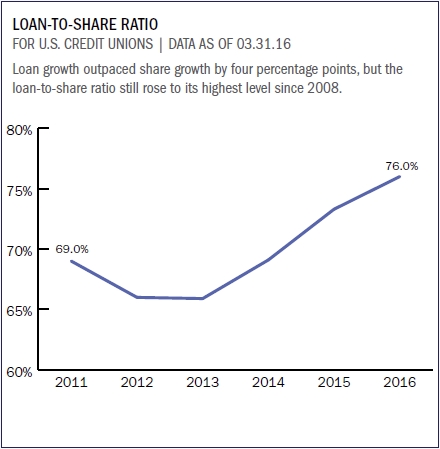
Credit unions originated $100.6 billion in loans in the first quarter of 2016, a 12.7% year-over-year increase and an all-time record for the first quarter. Consumer lending drove the majority of the increase, rising 17.1% year-over-year and expanding $9.2 billion. Although the 1.9% first mortgage origination growth lagged behind other categories, other real estate and member business lending originations made up for it with double-digit growth, increasing 19.7% and 15.6%, respectively. On the balance sheet, outstanding loan growth outpaced deposit growth by four percentage points 10.8% versus 6.7% which drove up the loan-to-share ratio to 76.0%.
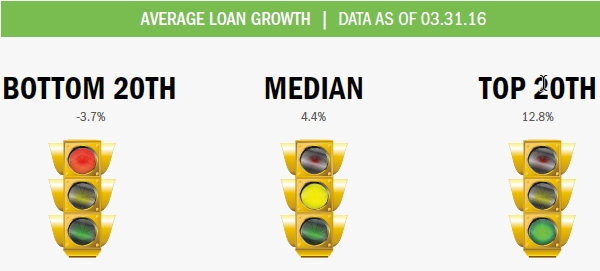
The median credit union loan portfolio expanded 4.4% year-over-year. Performers in the top 20th percentile posted 12.8% growth while credit unions in the bottom 20th percentile posted negative growth of -3.7%.
Source for all graphs, rankings, and maps unless otherwise noted: Peer-to-Peer Analytics by Callahan Associates.
| LENDING | AUTO LENDING | AUTO MARKET SHARE MAP |
| MORTGAGE LENDING | CREDIT CARDS | SHARES |
| MEMBER BUSINESS LENDING | INVESTMENTS | MEMBER RELATIONSHIPS |
| EARNINGS | SPECIAL SECTION: ASSET QUALITY |
Auto Lending
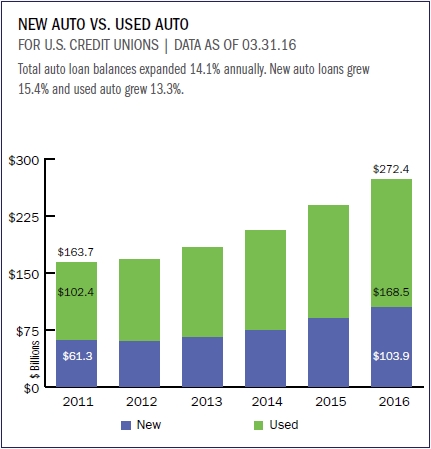
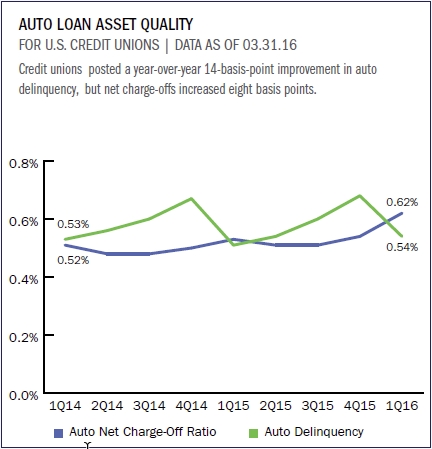
Total auto loans topped $272.4 billion in the first quarter of 2016. Auto loans accounted for more than one-third of total loans at credit unions and 43.2% of total loan growth over the past 12 months. Used auto loans accounted for more than half, 61.9%, of the auto loan portfolio. Auto loan delinquency rose to 0.54%, a three-basis-point year-over-year increase. The delinquency rate was three basis points for direct auto loans and 0.57% for indirect loans. Indirect lending surpassed direct in 2015, and the trend continues. As of March 31, 2016, 31.9% of credit unions have indirect lending on their books, up 90 basis points from first quarter 2015.

Auto loan balances increased 14.1% in the first quarter of 2016. Credit unions in the top 20th percentile reported auto loan growth of 19.7% while the median and bottom 20th percentile grew at a slower rate of 6.7% and -5.3%, respectively.
Source for all graphs, rankings, and maps unless otherwise noted: Peer-to-Peer Analytics by Callahan Associates.
| LENDING | AUTO LENDING | AUTO MARKET SHARE MAP |
| MORTGAGE LENDING | CREDIT CARDS | SHARES |
| MEMBER BUSINESS LENDING | INVESTMENTS | MEMBER RELATIONSHIPS |
| EARNINGS | SPECIAL SECTION: ASSET QUALITY |
Auto Market Share Map

Source for all graphs, rankings, and maps unless otherwise noted: Peer-to-Peer Analytics by Callahan Associates.
| LENDING | AUTO LENDING | AUTO MARKET SHARE MAP |
| MORTGAGE LENDING | CREDIT CARDS | SHARES |
| MEMBER BUSINESS LENDING | INVESTMENTS | MEMBER RELATIONSHIPS |
| EARNINGS | SPECIAL SECTION: ASSET QUALITY |
Mortgage Lending
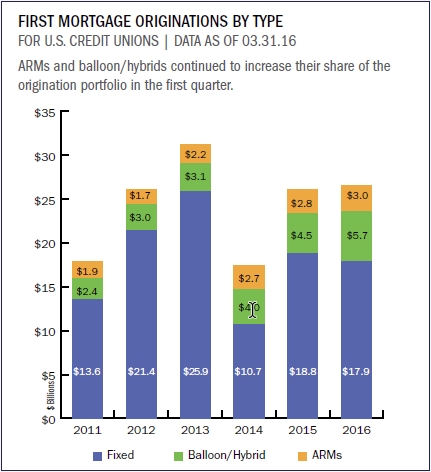
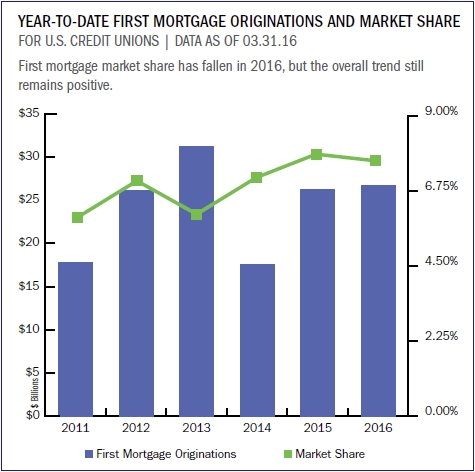
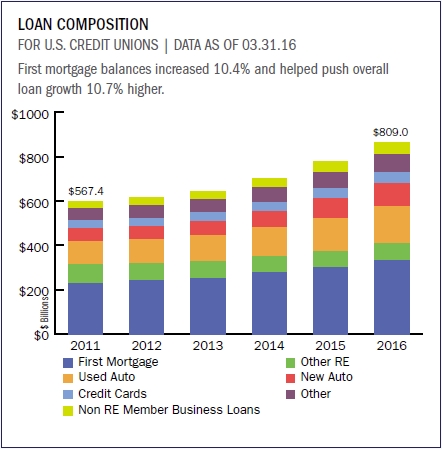
Credit unions originated $26.7 billion in mortgages in the first quarter of 2016. Fixed-rate mortgages accounted for 67.2% of total first mortgage originations, but their share of the origination portfolio has been declining. Adjustable rate and balloon/hybrid mortgages accounted for 11.3% and 21.5%, respectively, of first quarter first mortgage originations, a year-over-year increase for both. Although first mortgage origination growth was relatively flat in the first quarter, other real estate, which includes HELOCs, posted significant increases from the same period last year. In total, credit unions originated $6.1 billion in other real estate loans in the first three months of 2016, up 19.7% from first quarter 2015.
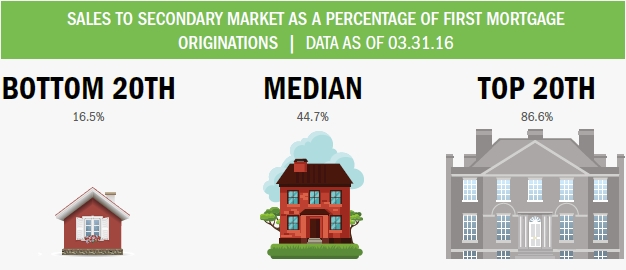
Credit unions in the bottom 20th percentile sold, on average, 16.5% of their first mortgage loan originations to the secondary market. The industry median for sales to the secondary market was 44.7%. Credit unions in the upper 20th percentile sold 86.6% on average.
Source for all graphs, rankings, and maps unless otherwise noted: Peer-to-Peer Analytics by Callahan Associates.
| LENDING | AUTO LENDING | AUTO MARKET SHARE MAP |
| MORTGAGE LENDING | CREDIT CARDS | SHARES |
| MEMBER BUSINESS LENDING | INVESTMENTS | MEMBER RELATIONSHIPS |
| EARNINGS | SPECIAL SECTION: ASSET QUALITY |
Credit Cards
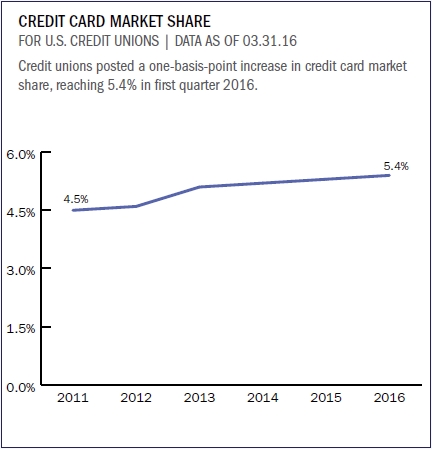
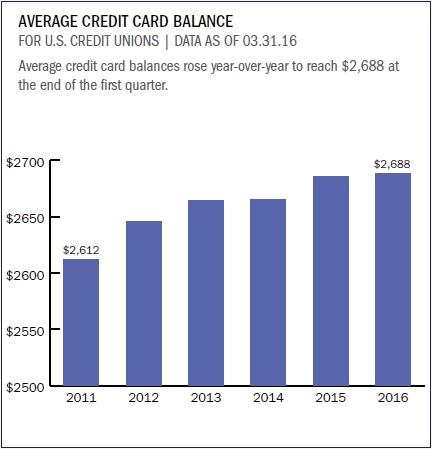
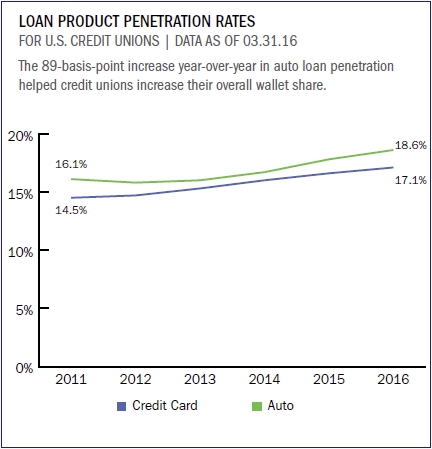
Credit unions reported 7.0% annual growth in credit cards as of March, 31, 2016. Total balances outstanding reached $48.3 billion and the average balance per card grew seven basis points over the past 12 months to reach $2,688. Credit card penetration among credit union members increased 50 basis points year-over-over, reaching 17.1% at the end of the first quarter. Credit card market share also rose 10 basis points year-over-year to top 5.4% in March 2016.
![]()
Compare. Learn. Excel.
With Callahan’s Peer-to-Peer, it’s easy to analyze a credit union’s credit card portfolio and strategy by comparing balance growth, penetration rates, and credit card usage. Start today!
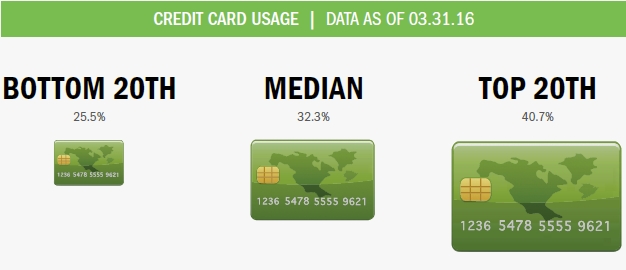
For all three percentile rankings bottom 20th, median, and top 20th credit card usage rates declined slightly year-over-year. Lower usage rates indicate lower outstanding balances as a percentage of available credit. When members are not fully using their credit cards, credit unions must monitor unfunded commitments in case borrowers decide to charge more throughout the year.
Source for all graphs, rankings, and maps unless otherwise noted: Peer-to-Peer Analytics by Callahan Associates.
| LENDING | AUTO LENDING | AUTO MARKET SHARE MAP |
| MORTGAGE LENDING | CREDIT CARDS | SHARES |
| MEMBER BUSINESS LENDING | INVESTMENTS | MEMBER RELATIONSHIPS |
| EARNINGS | SPECIAL SECTION: ASSET QUALITY |
Shares
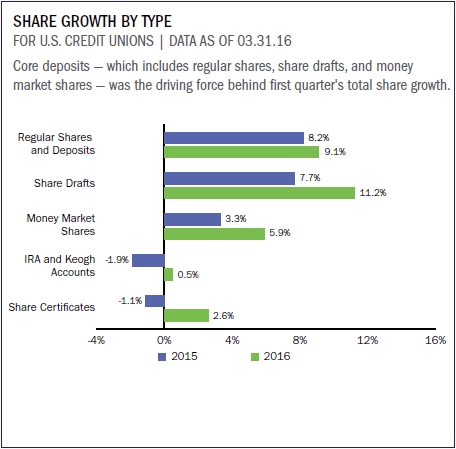
Credit unions posted a 6.7% year-over-year increase in share balances. The $67.2 billion added over the past 12 months brought balances near $1.1 trillion as of March 31, 2016. Core deposits regular shares, money market shares, and share drafts accounted for the bulk of share growth. Share draft balances were up 11.2% year-over-year to reach $157.6 billion. Longer-term IRA/Keoghs balances, on the other hand, were down 0.5% from March 2015. Share certificate balances also declined 2.6%. Although first quarter share growth was stable, the annual net liquidity change annual share growth minus annual loan growth has been negative since the third quarter of 2013 and the spread is widening.
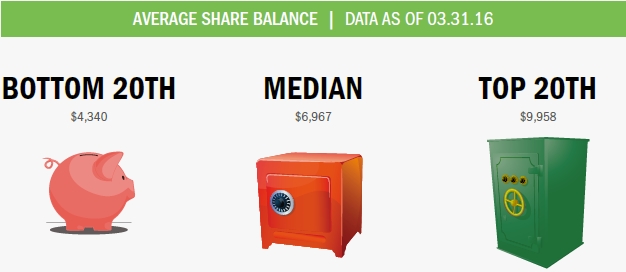
The average share balance for the industry increased 2.7% year-over-year. Credit unions in the top 20th percentile reported an average share balance of $9,958. Those in the middle 50th and bottom 20th percentiles reported average balances of $6,967 and $4,340, respectively.
Source for all graphs, rankings, and maps unless otherwise noted: Peer-to-Peer Analytics by Callahan Associates.
| LENDING | AUTO LENDING | AUTO MARKET SHARE MAP |
| MORTGAGE LENDING | CREDIT CARDS | SHARES |
| MEMBER BUSINESS LENDING | INVESTMENTS | MEMBER RELATIONSHIPS |
| EARNINGS | SPECIAL SECTION: ASSET QUALITY |
Member Business Lending
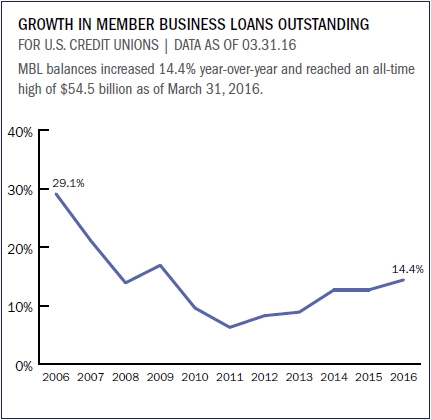
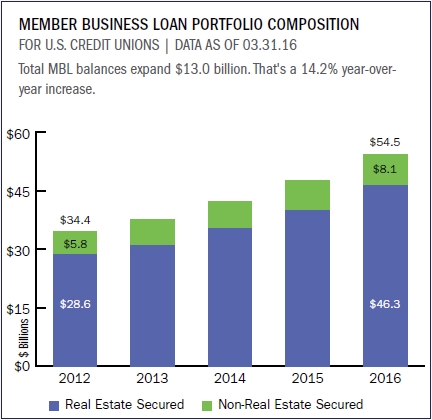
Member business loan balances at credit unions increased 14.4% year-over-year, reaching an all-time high of $54.5 billion as of March 31, 2016. In the first quarter of 2016, credit unions originated $4.8 billion in member business loans that’s up 15.6% from first quarter 2015. It is important for credit unions to manage risk within this growing segment of the loan portfolio, as business loan delinquency increased 56 basis points over March 2015 to 1.41% as of first quarter 2016.
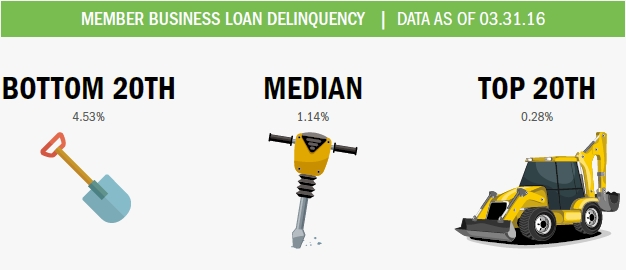
The median MBL delinquency reached 1.14% as of March 31, 2016. That’s more than three percentage points lower than credit unions in the bottom 20th percentile, which posted a 4.53% delinquency, but greater than the 0.28% posted by credit unions in the top 20th percentile.
Source for all graphs, rankings, and maps unless otherwise noted: Peer-to-Peer Analytics by Callahan Associates.
| LENDING | AUTO LENDING | AUTO MARKET SHARE MAP |
| MORTGAGE LENDING | CREDIT CARDS | SHARES |
| MEMBER BUSINESS LENDING | INVESTMENTS | MEMBER RELATIONSHIPS |
| EARNINGS | SPECIAL SECTION: ASSET QUALITY |
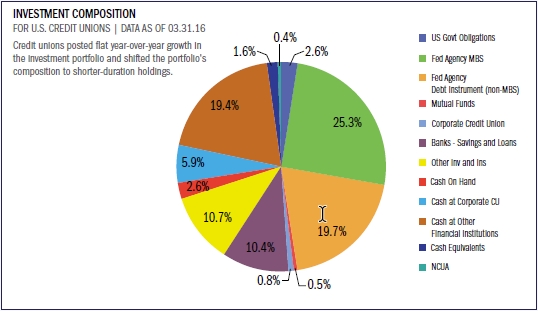
Investments
As of first quarter 2016, credit unions held $391.1 billion in investments and cash, an essentially flat growth rate from the same period in 2015. Total investments fell slightly as liquidity rose with share balances, following their usual pattern of posting the strongest growth in the first quarter of the year. The average investment maturity for all U.S. credit unions shortened in the first quarter of 2016. The largest increases occurred in cash and equivalents accounts and securities with maturities of less than one year, both increasing 7.7% and 2.5%, respectively, year-over-year.
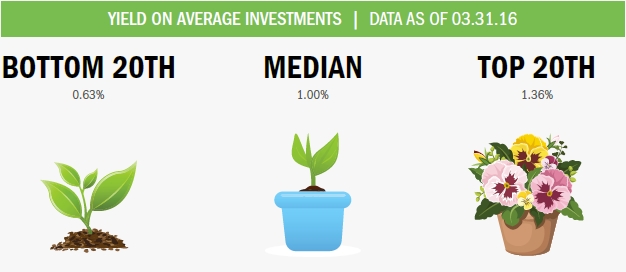
The median yield on average investments stood at 1.00% at the end of first quarter. That’s up from 0.88% one year ago. Credit unions ranked in the top 20th percentile reported an investment yield of 1.36% versus 0.63% for those in the bottom 20th.
Source for all graphs, rankings, and maps unless otherwise noted: Peer-to-Peer Analytics by Callahan Associates.
| LENDING | AUTO LENDING | AUTO MARKET SHARE MAP |
| MORTGAGE LENDING | CREDIT CARDS | SHARES |
| MEMBER BUSINESS LENDING | INVESTMENTS | MEMBER RELATIONSHIPS |
| EARNINGS | SPECIAL SECTION: ASSET QUALITY |
Member Relationships
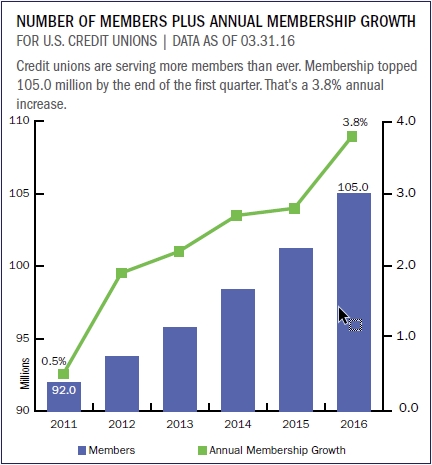
Member relationships at credit unions continued to grow in the first quarter of 2016. Credit unions originated more than 10.1 million loans for their 105.0 million members in the first three months of the year. Penetration metrics are up across all major product types, with share draft penetration posting a 90-basis-point improvement over the past 12 months to top 55.3% in the first quarter. Employment growth is on par with member growth at credit unions as both employment and membership expanded 3.8% annually. Members per employee remained flat at 384.
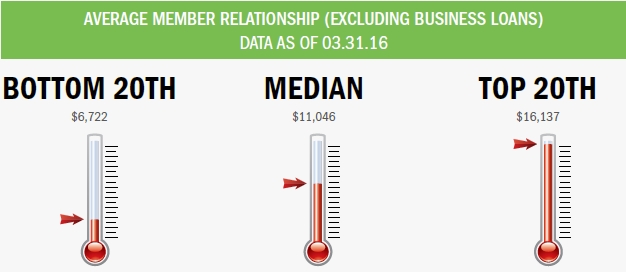
Top-performing credit unions posted an average member relationship of $16,137 that’s $5,901 above the median. Credit unions in the bottom 20th percentile reported an average member relationship of $6,722.
Source for all graphs, rankings, and maps unless otherwise noted: Peer-to-Peer Analytics by Callahan Associates.
| LENDING | AUTO LENDING | AUTO MARKET SHARE MAP |
| MORTGAGE LENDING | CREDIT CARDS | SHARES |
| MEMBER BUSINESS LENDING | INVESTMENTS | MEMBER RELATIONSHIPS |
| EARNINGS | SPECIAL SECTION: ASSET QUALITY |
Earnings
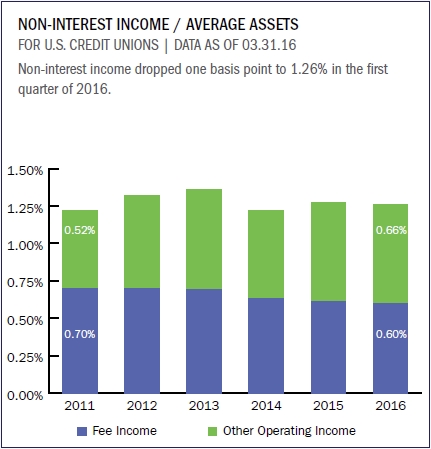
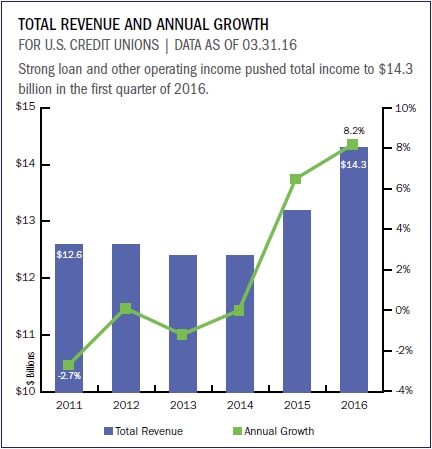
Total income increased 8.2% year-over-year to top $14 billion in the first quarter of 2016. Total interest income increased 9.0% annually, driven by strong loan growth within the portfolio. Investment income also grew 10.3% annually to reach $1.2 billion, offsetting a 3.8% decline in March 2015. Meanwhile, total non-interest income rose 6.4% compared to the year prior. Return on assets fell to 0.75% at the end of the first quarter, three basis points below first quarter results in 2015. The industry’s net worth ratio also dropped two basis points to 10.8%.
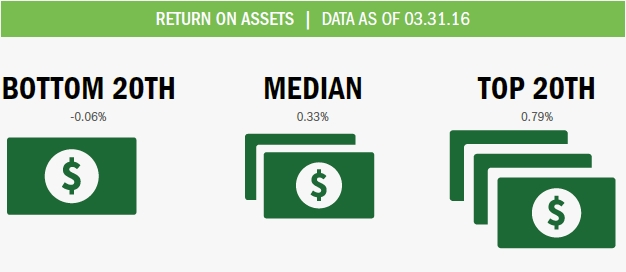
Asset growth outpaced net income growth, which pushed ROA down three basis points year-over-year. The industry median was 0.33% as of March 31, 2016. The upper and bottom percentiles spread further apart with credit unions in the bottom 20th percentile reporting an averge ROA of -0.06% and those in the top 20th percentile reporting 0.79% ROA.
Source for all graphs, rankings, and maps unless otherwise noted: Peer-to-Peer Analytics by Callahan Associates.
| LENDING | AUTO LENDING | AUTO MARKET SHARE MAP |
| MORTGAGE LENDING | CREDIT CARDS | SHARES |
| MEMBER BUSINESS LENDING | INVESTMENTS | MEMBER RELATIONSHIPS |
| EARNINGS | SPECIAL SECTION: ASSET QUALITY |
SPECIAL SECTION: ASSET QUALITY
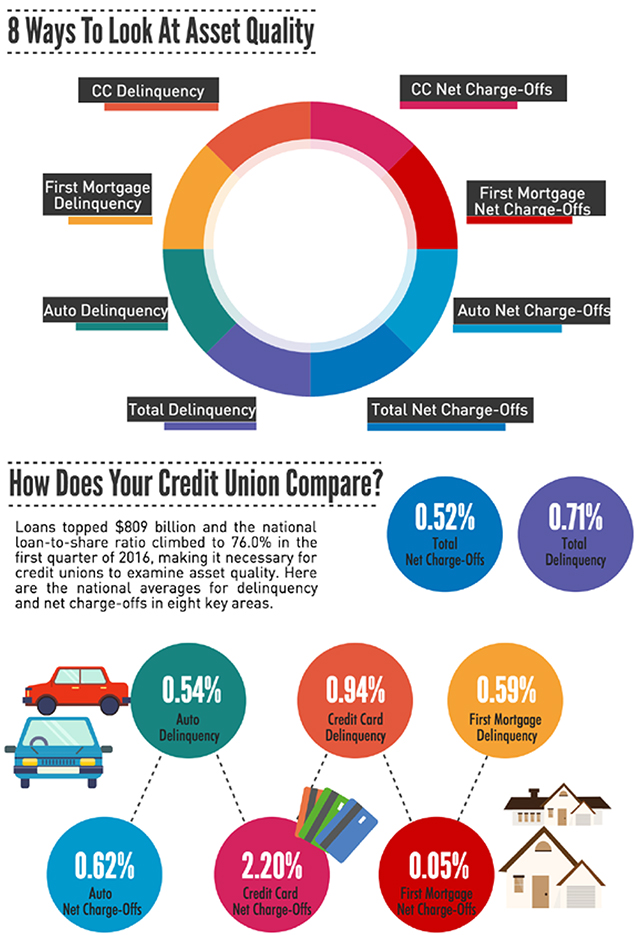
Source for all graphs, rankings, and maps unless otherwise noted: Peer-to-Peer Analytics by Callahan Associates.