
Read the full analysis or skip to the section you want to read by clicking on the links below.
LENDING AUTO LENDING AUTO MARKET SHARE MAP MORTGAGE LENDING CREDIT CARDS SHARES MEMBER BUSINESS LENDING INVESTMENTS MEMBER RELATIONSHIPS EARNINGS
Lending
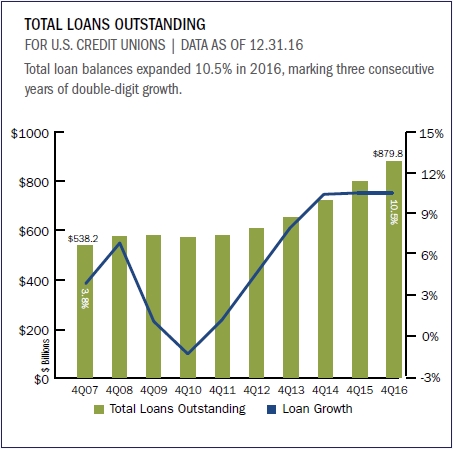
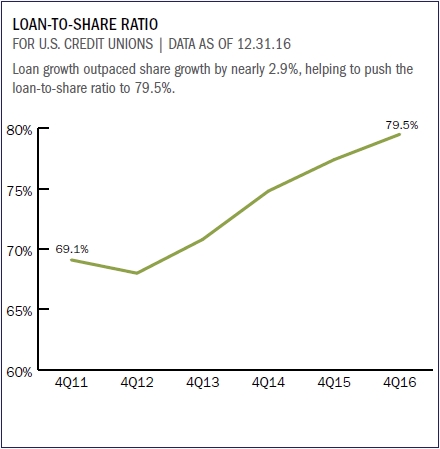
Credit unions lent $461.2 billion throughout 2016. This new record surpassed 2015’s total by 12.3%. With this increase in originations, outstanding loan growth was nearly 2.9 percentage points higher than the rate of share growth 10.5% versus 7.6%. As a result, the loan-to-share ratio which measures to what degree credit unions are loaned out continued to creep higher, rising to 79.5% from 77.4%.
First mortgage and used auto lending were the primary drivers of portfolio growth, expanding $32.0 billion and $20.3 billion, respectively, since the fourth quarter of 2016. Together, first mortgage and used auto loans accounted for 61.7% of the entire loan portfolio as of Dec. 31, 2016. New auto and member business lending posted the largest percent increases at 16.8% and 14.6%, respectively.

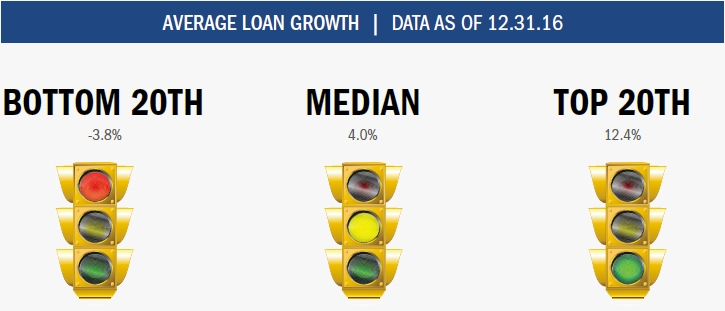
The median credit union loan portfolio expanded 4.0% year-over-year in 2016. Performers in the top 20th percentile posted 12.4% growth. Credit unions in the bottom 20th percentile posted growth of -3.8%.
These graphs, rankings, and maps come from Callahan’s Peer-to-Peer Analytics. See how Peer-to-Peer can help you created targeted credit union analysis. Request a demo.
LENDING AUTO LENDING AUTO MARKET SHARE MAP MORTGAGE LENDING CREDIT CARDS SHARES MEMBER BUSINESS LENDING INVESTMENTS MEMBER RELATIONSHIPS EARNINGS
Auto Lending
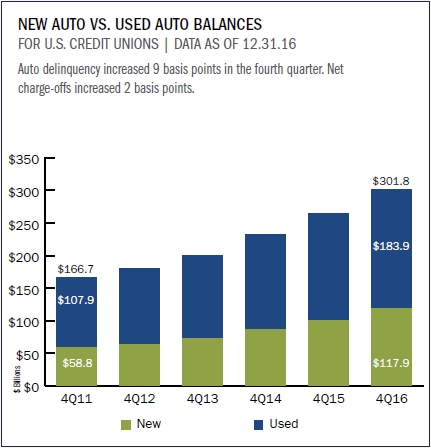
Credit unions reported new auto loan growth of 16.8% and used auto loan growth of 12.4% as of year-end 2016. That’s up from 16.0% and down from 12.7%, respectively, in 2015. Auto market share increased to 18.0%, a bump of 1.4 percentage points from the year prior.
New auto lending was the fastest-growing segment of the loan portfolio in 2016. Indirect lending played a significant role in the growth of the total auto portfolio in 2016. At year-end, indirect loans accounted for 55.1% of total auto loans, up from 51.9% in 2015.
Auto delinquency climbed 9 basis points in the fourth quarter, marking the fourth consecutive quarterly increase. However, credit unions are managing losses well, as net charge-offs increased only 2 basis points over the period.

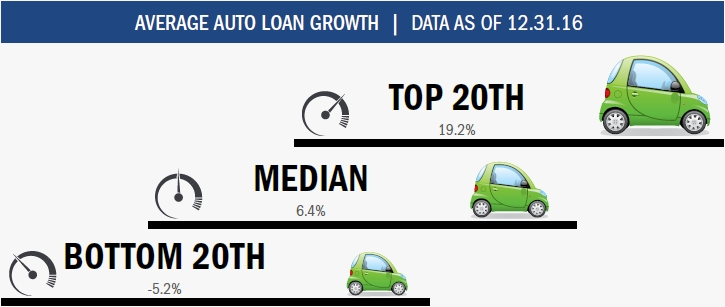
Large lenders enjoyed notable success in 2016, driving up the average auto balance growth rate to 14.1%. Median auto growth was 6.4%. The top 20th and bottom 20th percentiles grew 19.2% and fell 5.2%, respectively.
These graphs, rankings, and maps come from Callahan’s Peer-to-Peer Analytics. See how Peer-to-Peer can help you created targeted credit union analysis. Request a demo.
LENDING AUTO LENDING AUTO MARKET SHARE MAP MORTGAGE LENDING CREDIT CARDS SHARES MEMBER BUSINESS LENDING INVESTMENTS MEMBER RELATIONSHIPS EARNINGS
Auto Market Share Map

These graphs, rankings, and maps come from Callahan’s Peer-to-Peer Analytics. See how Peer-to-Peer can help you created targeted credit union analysis. Request a demo.
LENDING AUTO LENDING AUTO MARKET SHARE MAP MORTGAGE LENDING CREDIT CARDS SHARES MEMBER BUSINESS LENDING INVESTMENTS MEMBER RELATIONSHIPS EARNINGS
Mortgage Lending
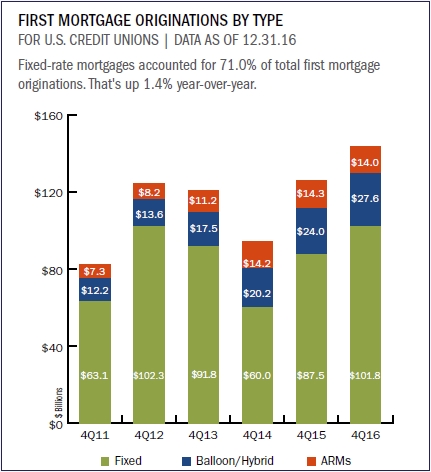
First mortgage originations posted strong growth in the fourth quarter. Loan originations increased 14.1% year-over-year and ended 2016 at $143.5 billion. That’s an all-time high for credit union mortgage originations.
Total first mortgages outstanding increased on the balance sheet as well. As of Dec. 31, 2016, credit unions held $359.0 billion in first mortgages. First mortgage balances outstanding have increased 9.8% over the past 12-months. Notably, first mortgages outstanding have posted annual growth of at least 9% in every quarter since June 2015.
Total mortgage activity for credit unions is higher than these numbers suggest, as credit unions sold 39.5% of total first mortgage originations on the secondary market in 2016. That’s up from 38.8% in 2015.

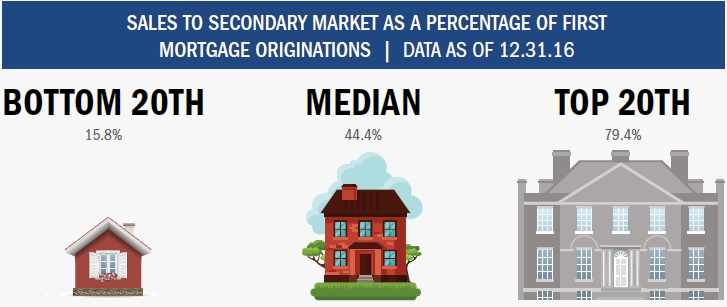
Sales to the secondary market increased 16.2% year-over-year to $56.7 billion as of Dec. 31, 2016. Credit unions in the bottom 20th percentile sold, on average, 15.8% of their first mortgage loan originations to the secondary market. The industry median for sales to the secondary marketfell to 44.4% from 45.1%.Credit unions in the upper 20th percentile sold 79.4% on average.
These graphs, rankings, and maps come from Callahan’s Peer-to-Peer Analytics. See how Peer-to-Peer can help you created targeted credit union analysis. Request a demo.
LENDING AUTO LENDING AUTO MARKET SHARE MAP MORTGAGE LENDING CREDIT CARDS SHARES MEMBER BUSINESS LENDING INVESTMENTS MEMBER RELATIONSHIPS EARNINGS
Credit Cards
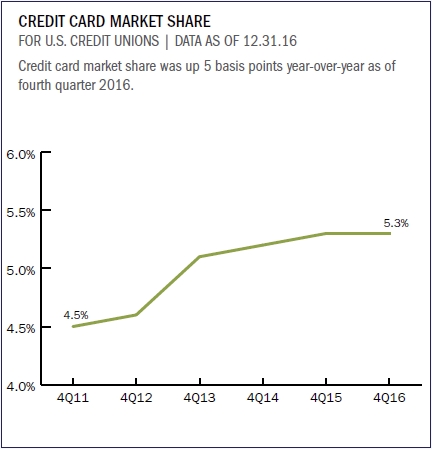
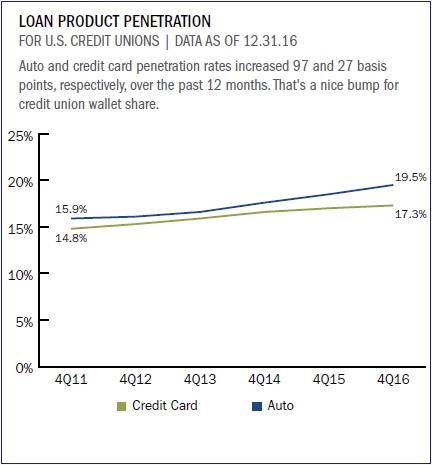
The credit union credit card portfolio increased $3.9 billion, or 7.9%, over the past 12 months and reached $53.2 billion as of year-end 2016. Credit card penetration was 17.3% as of fourth quarter. Total credit union credit card market share increased 5 basis points to 5.3%. The average credit card balance increased 2.0% to $2,838. That’s up $56 year-over-year and is the largest annual increase since September 2010.
As of year-end 2016, 60.1% of credit unions reported holding credit card loans on their books with a total of 18.7 million credit cards lines outstanding.

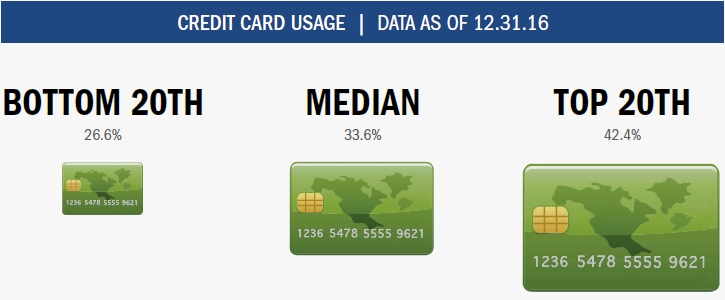
Usage rates across each percentile declined from previous year-end levels, with the top 20th, median, and bottom 20th declining 34, 72, and 33 basis points, respectively.
Compare. Learn. Excel.
With Callahan’s Peer-to-Peer, it’s easy to analyze a credit union’s credit card portfolio and strategy by comparing balance growth, penetration rates, and credit card usage. Start today!
These graphs, rankings, and maps come from Callahan’s Peer-to-Peer Analytics. See how Peer-to-Peer can help you created targeted credit union analysis. Request a demo.
LENDING AUTO LENDING AUTO MARKET SHARE MAP MORTGAGE LENDING CREDIT CARDS SHARES MEMBER BUSINESS LENDING INVESTMENTS MEMBER RELATIONSHIPS EARNINGS
Shares
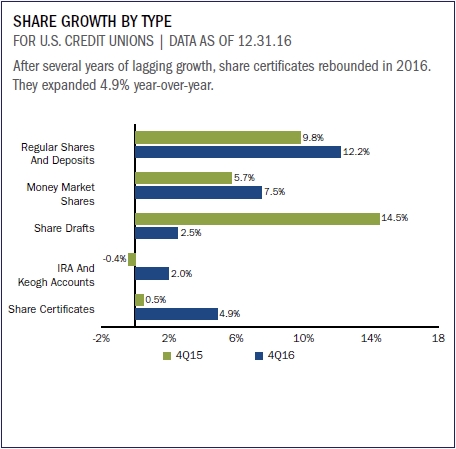
Core deposits which are composed of regular shares, share drafts, and money market shares grew 8.6% in 2016 and surpassed $800 billion in the fourth quarter. Core deposit growth underpinned the 7.6% growth in total shares, which reached $1.1 trillion at year-end. Regular shares and deposits accounted for the largest growth in the portfolio they increased 12.2% followed by money market shares at 7.5%. Share certificates recorded the third-fastest growth in the portfolio, 4.9%. This marked the strongest growth rate since June 2008.
Average share balance across all credit unions reached $10,146 and accounted for 57.3% of the average member relationship in the fourth quarter.
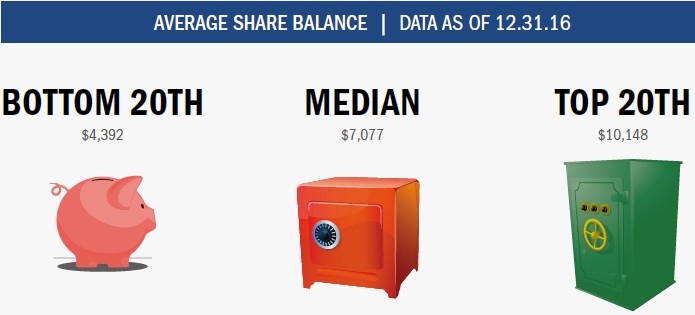
The average share balance for the industry increased 3.2% year-over-year. Credit unions in the top 20th percentile reported an average share balance of $10,148. Those in the median and bottom 20th percentiles reported average balances of $7,077 and $4,392, respectively.
These graphs, rankings, and maps come from Callahan’s Peer-to-Peer Analytics. See how Peer-to-Peer can help you created targeted credit union analysis. Request a demo.
LENDING AUTO LENDING AUTO MARKET SHARE MAP MORTGAGE LENDING CREDIT CARDS SHARES MEMBER BUSINESS LENDING INVESTMENTS MEMBER RELATIONSHIPS EARNINGS
Member Business Lending
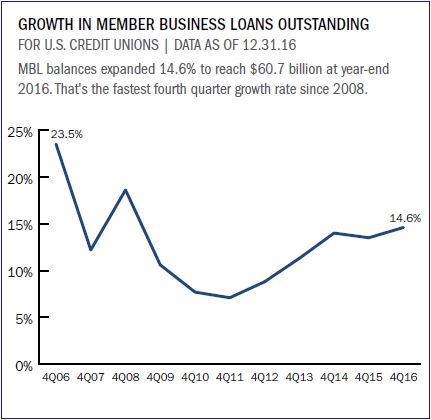
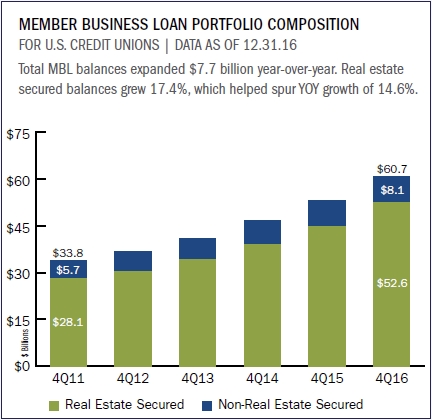
Member business loans recorded the second-largest growth rate in the loan portfolio, accelerating 14.6% to surpass $60 billion in total balances. Originations of member business loans also posted significant growth, increasing 15.2% over the same period.
Member business loans continue to grow in size and share. Today, MBL accounts for 6.9% of the total credit union loan portfolio, up from 6.6% a year prior. Average member business loan balances rose 6.2% to more than $236,000.
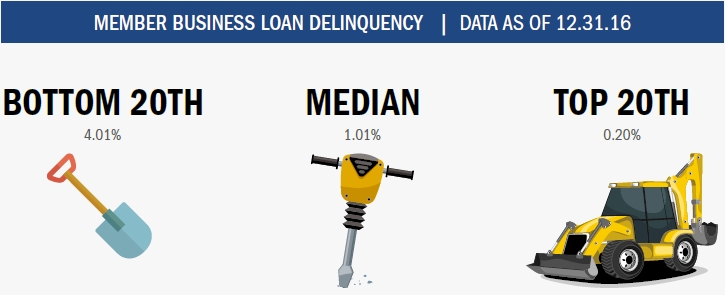
The median MBL delinquency fell to 1.01% in the fourth quarter of 2016. That’s 3 percentage points lower than credit unions in the bottom 20th percentile. Credit unions in the top 20th percentile posted an MBL delinquency rate of 0.20%. The industry average MBL delinquency rate, heavily impacted by large lenders, rose to 1.53% as of Dec 31, 2016.
These graphs, rankings, and maps come from Callahan’s Peer-to-Peer Analytics. See how Peer-to-Peer can help you created targeted credit union analysis. Request a demo.
LENDING AUTO LENDING AUTO MARKET SHARE MAP MORTGAGE LENDING CREDIT CARDS SHARES MEMBER BUSINESS LENDING INVESTMENTS MEMBER RELATIONSHIPS EARNINGS
Investments
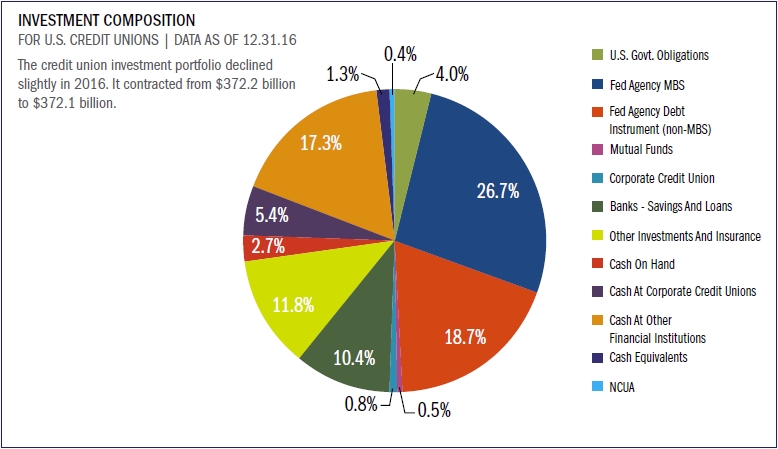
Credit unions had $372.1 billion in investments and cash as of Dec. 31, 2016. This is on par with year-end 2015. Fed agency debt instruments, the largest losses in the investment portfolio, were down approximately 9.5% year-over-year. However, cash at other financial institutions and Fed agency MBS increased by 6.4% and 4.2%, respectively, over last year.
Although there was a small decrease in YOY investments, the shift from third quarter 2016 was larger. Since last quarter, investments have decreased $8.6 billion, the largest decrease being in cash at other financial institutions. Contrary to its YOY growth, cash at other financial institutions decreased nearly $10 billion from Sept. 30, 2016, to Dec. 31, 2016.
Investments were down relative to both last quarter and last year, but yield on investments was up. The bottom 20th percentile and the median investment yield were both higher than the third and fourth quarters of 2015.
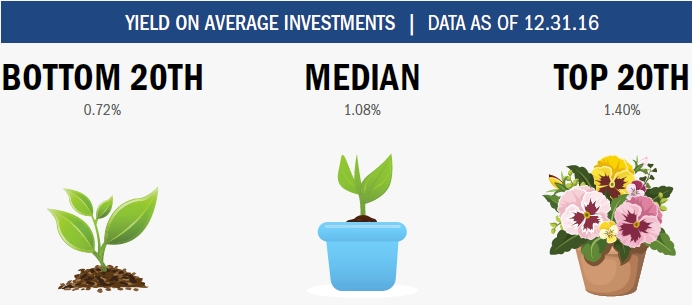
Yields on investments have increased at credit unions. The bottom 20th, median, and top 20th were all up 15, 12 and 7 basis points, respectively, since last year.
These graphs, rankings, and maps come from Callahan’s Peer-to-Peer Analytics. See how Peer-to-Peer can help you created targeted credit union analysis. Request a demo.
LENDING AUTO LENDING AUTO MARKET SHARE MAP MORTGAGE LENDING CREDIT CARDS SHARES MEMBER BUSINESS LENDING INVESTMENTS MEMBER RELATIONSHIPS EARNINGS
Member Relationships
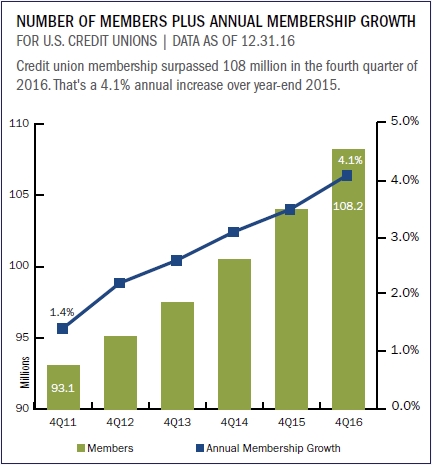
Credit union membership increased 4.1% the largest year-over-year increase since March 2001. At year-end, cooperatives served more than 108 million members. Credit card and auto loan penetration rates are increasing as members become more engaged. Credit card penetration was 17.3% in the fourth quarter; that’s up 27 basis points. Auto loan penetration increased from 18.5% to 19.5% year-over-year.
Thanks to accelerating loan growth and improving share growth, the average member relationship, which is a product of the aforementioned activities, topped $17,700 a YOY growth rate of 4.3%. Higher penetration rates across credit cards and mortgages, along with greater lending activity, shows how members strengthened their relationships with credit unions in 2016.
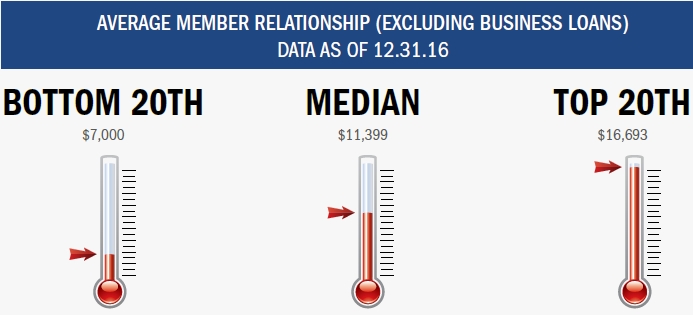
The average member relationship for the credit union industry increased 4.3% year-over-year. Top-performing credit unions posted an average member relationship of $16,693 as of December 31, 2016 $5,294 above the median. Credit unions in the bottom 20% had an average member relationship of $7,000.
These graphs, rankings, and maps come from Callahan’s Peer-to-Peer Analytics. See how Peer-to-Peer can help you created targeted credit union analysis. Request a demo.
LENDING AUTO LENDING AUTO MARKET SHARE MAP MORTGAGE LENDING CREDIT CARDS SHARES MEMBER BUSINESS LENDING INVESTMENTS MEMBER RELATIONSHIPS EARNINGS
Earnings
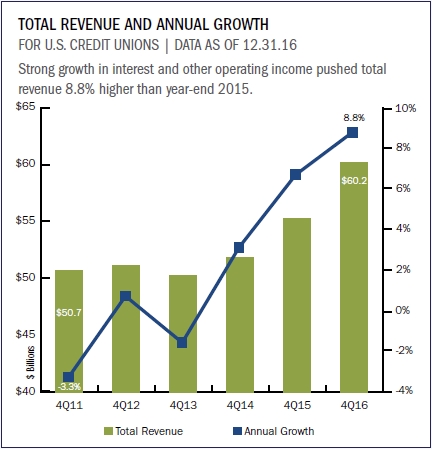
Total revenue for all credit unions surpassed $60 billion at year-end 2016, which represented year-over-year growth of 8.8%. The increase in total revenue resulted from an uptick in non-interest and interest income, which increased 9.8% and 8.7%, respectively. Non-interest income reached $17.6 billion, whereas the bulk of revenue, interest income, reached $43.1 billion.
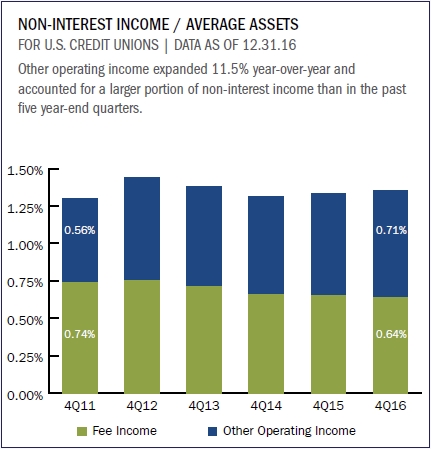
Fee income as a percentage of average assets fell 1 basis point year-over-year, but the 3-basis-point increase in other non-interest income more than offset the difference. Gains in other operating income, which rose 11.5% to $8.9 billion, were largely the result of increased secondary market activity, specifically mortgage sales.
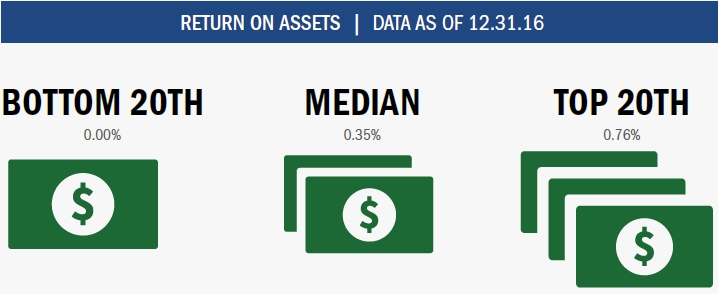
Asset growth outpaced earnings growth, and ROA increased 2 basis points year-over-year for credit unions nationally. ROA remained at 0.00% for credit unions in the bottom 20th percentile, whereas those in the median and top 20th percentile increased 2 basis points and 1 basis point, respectively.
These graphs, rankings, and maps come from Callahan’s Peer-to-Peer Analytics. See how Peer-to-Peer can help you created targeted credit union analysis. Request a demo.