Who Are The Top 10 Core Providers For U.S. Credit Unions?
The big three hold roughly half of the industry’s market share, but some smaller players are making gains.
The big three hold roughly half of the industry’s market share, but some smaller players are making gains.
Increases in the federal funds rate normally have a negative effect on the loan-to-share ratio, but things were different in the third quarter.
A confluence of major factors have resulted in some of the weakest share growth in several years.
Auto inflation has slowed since its second quarter peak but remains significantly higher than historical levels.
Record inflation has contributed to a surge in credit card spending, reversing a trend noted early in the pandemic.
If history is a guide, the average yield on loans will take time to adjust to the sharp increases in the federal funds rate.
A map of the United States shows where credit unions dominate in different areas of the loan portfolio.
In honor of International Credit Union Day, a look at how credit union dividends have shifted over time and why a rebound might be just around the corner.
High inflation and low unemployment are clashing, resulting in economic pessimism that hasn’t been seen in more than a decade.
After a pandemic-era spike, American consumers are saving at a lower rate than they have in over a decade.

This year’s finalists are reimagining how credit unions use data to boost service levels and improve efficiencies.

In order to adopt a more proactive strategy, the Iowa cooperative is using a dedicated product development team to promote visibility and follow-through from idea to launch.

This year’s finalists are reimagining how credit unions can use AI to combine cutting-edge technology with old-school member service.

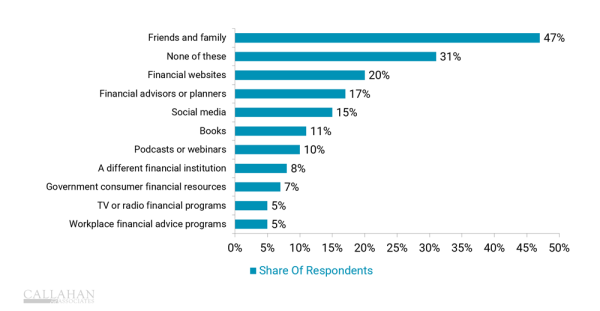
Financial advice comes in many forms. How can credits union make sure they are the No. 1 choice for their members?

This year’s finalists are uncovering new ways to harness the power of technology to improve and expand lending across the industry.

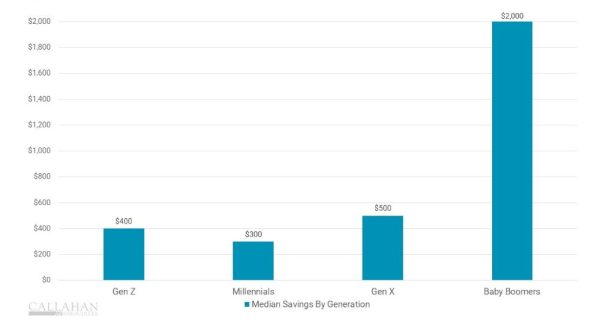
A program to help staffers improve their savings skills generated more than $200,000 in deposits and helped change participants’ financial habits.

As Super Bowl LX nears, the Callahan Bowl prediction model says the Seahawks will see green en route to the Lombardi Trophy.

Lending is evolving, and credit unions are adapting. This week, CreditUnions.com examines how shifting economic conditions are reshaping lending strategies.

Affordability pressures, extended loan terms, and shifting vehicle values are forcing institutions to look beyond familiar structures and reconsider how to balance risk and return.

Credit unions are uniquely well-positioned to guide members through uncertainty and fill essential funding gaps.