Higher rates are making everything more expensive for everyone.
What Is The Earnings Model?
Key revenue + expense items = bottom-line net income, otherwise known as return on assets.
It’s more expensive for members to take out loans. It’s more expensive for credit unions to acquire the funds to support lending, too. And as members struggle to balance budgets amid higher expenses, credit unions must respond by setting aside more money to cover potential defaults on the loans they do make.
Unfortunately, it’s not just higher rates that are wreaking havoc. Operating costs — including staff compensation and professional service costs — are on the rise. Thanks to all these expenses, the industry has generated less net income in 2024 than in years prior, even with greater loan income.
The look back isn’t so great. But with the Federal Reserve poised to cut interest rates in the coming year, the near-term outlook for the earnings model is much more promising.
INTEREST INCOME VS. INTEREST EXPENSE
FOR U.S. CREDIT UNIONS
SOURCE: Callahan & Associates
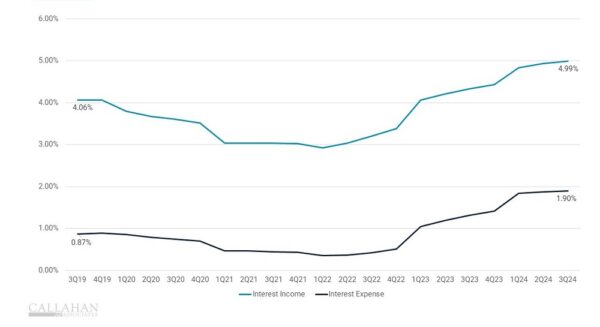
- Interest Income: Credit union interest income has increased alongside the Federal Reserve’s recent interest rate hikes. Credit unions have repriced loan and investment portfolios as members have paid off old, low-rate loans. As a result, interest income as a percentage of average assets has climbed — 66 basis points year-over-year to 4.99% — primarily from interest on loans. During the same period, the average loan yield increased 54 basis points to 5.78%.
- Interest Expense: Interest expense has increased in nearly equal measure with interest income the past two years as loans have hung on the balance sheet and core deposit growth has slowed. But things changed in 2024. Loan growth decelerated, matching sluggish share growth and reducing the need for costly funds. Consequently, the cost of funds flattened as credit unions paid down borrowings and slowed certificate promotions. For now, credit unions are not taking on any new, expensive funding, opting instead to maintain operations using existing liquidity. When the Fed cuts rates, acquiring funds will be cheaper, which will help credit unions manage their margins.
OPERATING EXPENSE RATIO VS. NET INTEREST MARGIN
FOR U.S. CREDIT UNIONS
SOURCE: Callahan & Associates
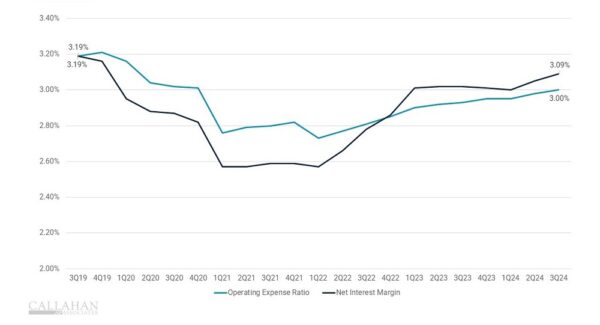
- Net Interest Margin: The net interest margin expanded modestly year-over-year. However, in the third quarter alone it increased 9 basis points to 3.09% thanks to higher yields and a flat cost of funds.
- Operating Expense: Unfortunately, inflation and business costs also ticked up, and the 9-basis-point gap between the net interest margin and the operating expense ratio remained unchanged year-over-year.
- Culture And Member Service: Credit unions can cover primary operations purely through core interest channels, but doing so could prove detrimental to culture and member service. Consider:
- Annual growth in new hiring slowed to just 0.7% in the third quarter.
- The average full-time equivalent employee handled 405 members and $6.6 million in assets. That workload might be working for the time being, especially as membership growth as well as loan growth has slowed, but leaders should carefully weigh efficiency against member service and staff burnout.
- It is historically rare for the net interest margin to exceed the operating expense ratio. Operational efficiency is important, but it’s also important to ensure cuts are made in the appropriate places.
NON-INTEREST INCOME AS A PERCENTAGE OF AVERAGE ASSETS
FOR U.S. CREDIT UNIONS
SOURCE: Callahan & Associates
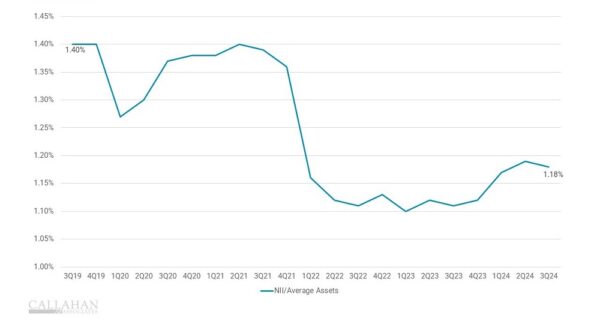
- Non-Interest Income: If interest channels cannot adequately cover operating expenses, credit unions will need to increase their reliance on non-interest income channels. While the net interest margin and operating expense ratio have moved in lockstep, NII streams have improved slightly. That said, NII is way down from pandemic peaks mainly because credit unions are selling fewer mortgages to the secondary market.
- Fee Income: Fee income comprises slightly more than one-third of NII. Despite being a hot button issue, fee income has been on the decline for decades. The average credit union member can expect to pay approximately $70 in fees in 2024.
CREDIT UNION EARNINGS MODEL
FOR U.S. CREDIT UNIONS
SOURCE: Callahan & Associates
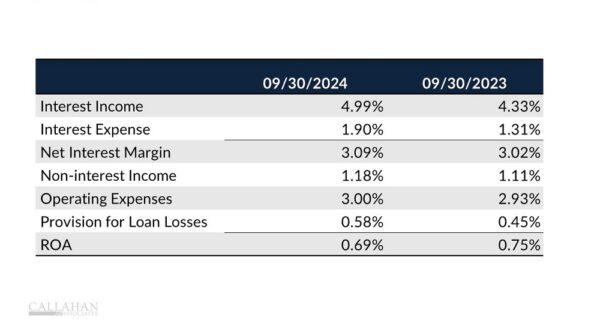
- Provision For Loan Losses: Provisions for loan losses — the money set aside for future defaults — has been ticking up on a quarterly basis. CECL is partially to blame, but asset quality also has been worsening. Thanks to this provisioning, however, the coverage ratio sits at a comfortable 140.9%. This is important because it helps credit unions hold off on charging off delinquent loans, which, in turn, helps members in need.
- Return On Assets (ROA): All told, operating expenses and provisions have suppressed net income growth. Consequently, ROA has declined 6 basis points year-over-year to 0.69%. Paying down borrowings and pulling back on certificate offerings improved the net interest margin and helped offset rising operating expenses and provisions, but ROA is still lower than historical norms, which have hovered around 0.75%.
- Interest Rates And ROA: Changes in the interest rate environment will affect ROA, and many credit unions are managing balance sheets with the explicit goal of maximizing flexibility, staying nimble enough to adjust to whatever the future might bring.
BANK VS. CREDIT UNIN COMPARISON
FOR U.S. BANKS AND CREDIT UNIONS
SOURCE: Callahan & Associates
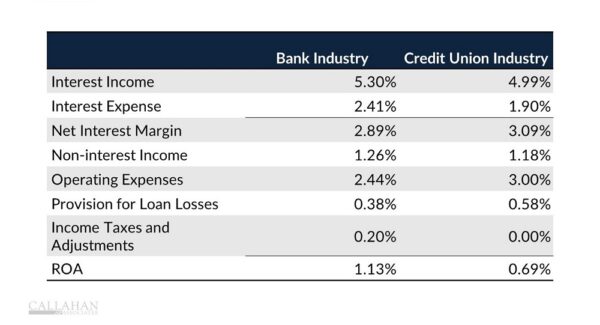
- Loans: Banks are charging borrowers more for loans than credit unions; they’re also paying more for the funding to do so. Both metrics are beholden to rates set by the Federal Reserve, so banks are simply borrowing more to maintain a loan-to-deposit ratio in the low 70s, as they have done since the start of last year. Interest expenses topped $576 billion in the third quarter, up from $158 billion prior to the pandemic. These higher expenses have resulted in banks’ net interest margin dipping to 2.89%, lower than credit unions’ 3.09% margin in the third quarter.
- Net Interest Margin Versus Operating Expenses: At 45 basis points, the gap between the net interest margin and the operating expense ratio was much wider for banks than for credit unions. This is unsurprising given banks’ focus on efficiency and profitability versus credit unions’ focus on member service. That said, banks’ operating expense ratio is their biggest advantage when it comes to the earnings model. Scale certainly helps here, as does streamlined online and self-service products.
- Mission: Banks also don’t have the same mission to serve the underserved. That means they can work primarily with borrowers who have high credit scores and lower chances of defaulting. With less risk on the books, banks don’t need to set aside as much to cover credit losses, an expense that has severely impacted credit union earnings the past year.
- Taxation: Although banks pay income taxes, the industry still reported an annualized return on assets of 1.13% in the third quarter. That’s 44 basis points higher than the average credit union ROA and 2 basis points higher than the industry’s all-time record ROA. In sum, banks are making their profits even as credit unions serve more members.
Your Performance Packet Is Ready. It’s Time To Take Your Credit Union To The Next Level. Sit down with a Callahan advisor to review your tailored performance packet, and we’ll show you how your credit union measures up against peers in revenue, expenses, ROA, and more. Armed with this knowledge, your leadership team can make better plans and set stronger goals. What are you waiting for? Request your session today.