Credit union leaders might feel a sense of déjà vu when they dive into third quarter performance results. That’s because major trends from the second quarter — including declining liquidity, deteriorating asset quality, and weaker loan demand — have continued into the third quarter of the year.
Although these trends have had a significant impact on the credit union industry, many of them represent a return to economic normalcy. Interest rates and asset quality are both on the rise from their historic lows, whereas loan originations have fallen to pre-pandemic levels.
Indeed, the beginning of the fourth quarter is bringing with it a sense of economic normalization — albeit with uncertainty. For now, consider the following key takeaways from early performance data.
No. 1: Weaker Savings Is Impacting Share Growth
PERSONAL SAVINGS VS. SHARE GROWTH
FOR ALL U.S. CITIZENS | DATA AS OF 09.30.23
© Callahan & Associates | CreditUnions.com
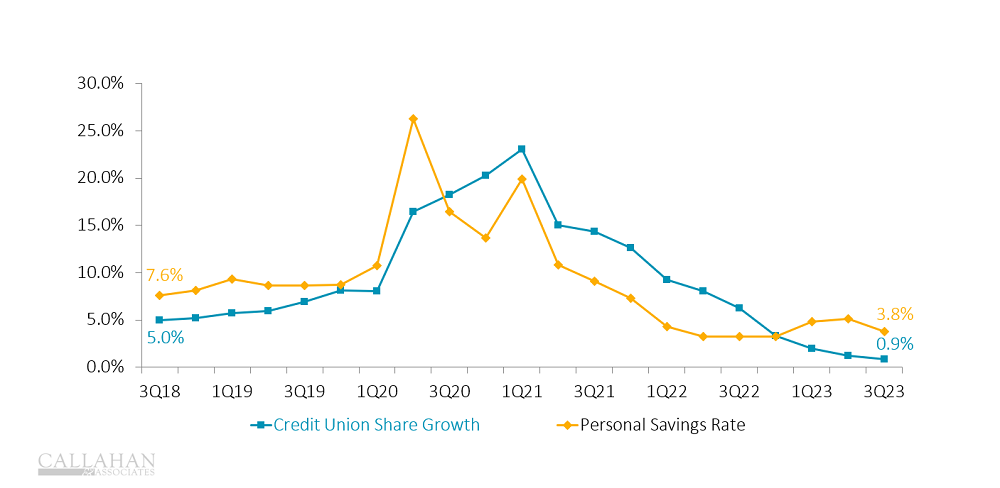
- The U.S. personal savings rate fell from 5.1% in the second quarter to 3.8% as of Sept. 30. As personal savings ties directly into deposit growth, it is no surprise share growth at credit unions remained nearly flat, expanding just 0.9% year-over-year in the third quarter.
- Increased debt load, interest payments on loans, and cost of living means American have fewer dollars to save at the end of the day. In turn, credit unions have fewer deposits to lend out and collect interest on.
No. 2: Delinquencies Are Back To Pre-Pandemic Averages
ASSET QUALITY
FOR U.S. CREDIT UNIONS | DATA AS OF 09.30.23
© Callahan & Associates | CreditUnions.com
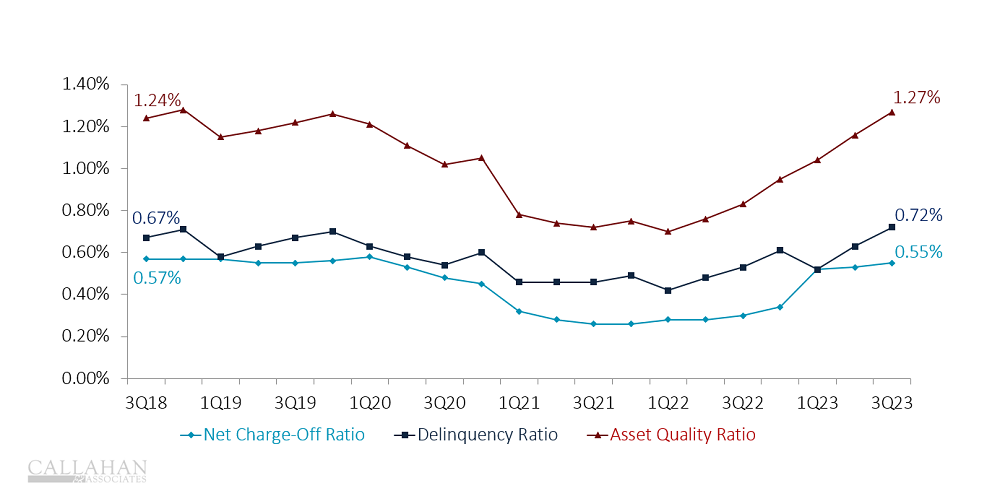
- Credit union asset quality has inched back up to pre-pandemic norms during the past 12 months. Delinquency and net charge-offs have both climbed, reaching 0.72% and 0.55%, respectively, at the end of the third quarter.
- During the pandemic, Americans built up savings and paid down debt, which improved asset quality. However, asset quality has worsened in the absence of pandemic-based economic aid.
- The resumption of student loan payments could further strain asset quality at credit unions as borrowers with student loans as well as other debt make tough decisions on which loans to repay and when.
No. 3: Credit Unions Are Diversifying Funding Sources
BORROWING TO ASSETS
FOR U.S. CREDIT UNIONS | DATA AS OF 09.30.23
© Callahan & Associates | CreditUnions.com
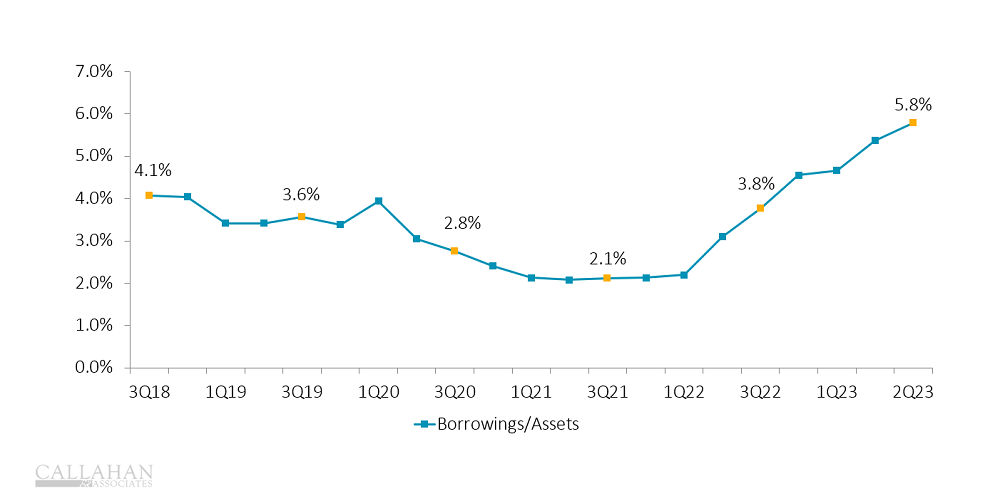
- Borrowings rose 59.5% year-over-year as credit unions continued their search for liquidity. Although annual growth was down from the 89.5% reported in the third quarter of 2022, borrowing continues to grow as a percentage of assets. At this point, borrowing has reached an unprecedented 5.8% of assets.
- When credit unions have to raise dividends rates to attract shares, borrowing becomes an attractive way to raise liquidity. However, elevated interest rates has increased borrowing expenses, which has lifted the overall cost of funds.
No. 4: ROA Declines Despite Record Revenue
RETURN ON ASSETS
FOR U.S. CREDIT UNIONS | DATA AS OF 09.30.23
© Callahan & Associates | CreditUnions.com
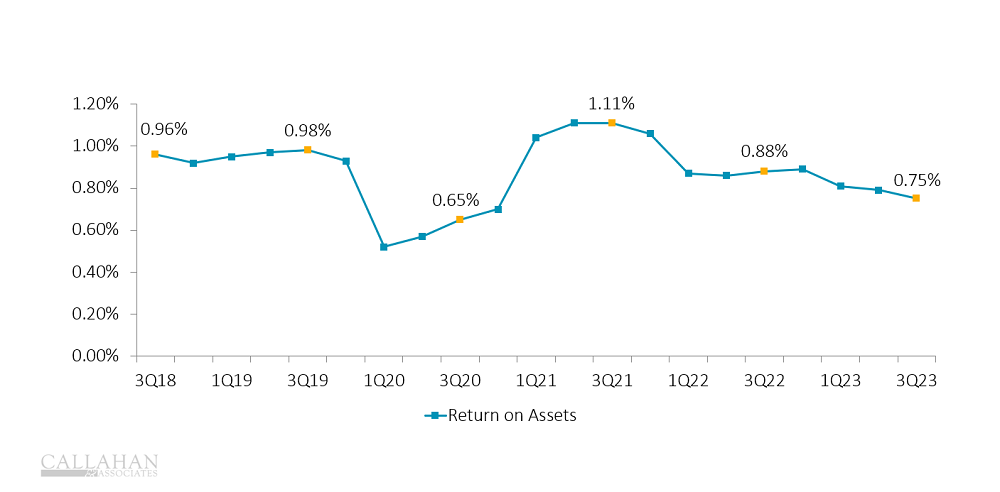
- Return on assets fell 13 basis points year-over-year to 0.75% in the third quarter. Although interest income has risen across the industry, so have operating and interest expenses — 8.9% and 228.5%, respectively — which has compressed ROA.
- Provision expenses more than doubled during the past year. As delinquencies rose, credit unions increased their provisions for loan losses, further compressing margins and lowering ROA.
No. 5: Higher Interest Rates Have Reduced Loan Demand
QUARTERLY LOAN ORIGINATIONS VS. FED FUNDS RATE
FOR U.S. CREDIT UNIONS | DATA AS OF 09.30.23
© Callahan & Associates | CreditUnions.com
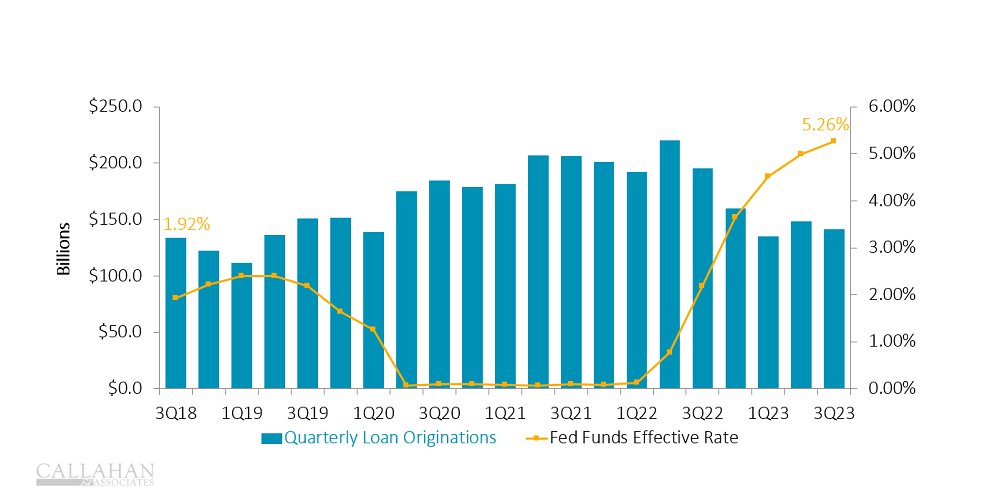
- In the first quarter of 2022, the Federal Reserve started raising interest rates to combat inflation. When the federal funds rate increases, so, too, do the rates credit unions charge for loans. Consequently, the demand for loans decreases.
- Year-to-date loan originations fell 24.3% from one year ago, when the COVID-19 boom was fueling loan originations. Today — thanks to higher rates and a normalizing, post-pandemic economy — loan originations have returned to pre-pandemic levels.
Don’t Wait For Data
Callahan’s online performance benchmarking tool provides an early look at quarterly performance results — giving leaders crucial insight weeks before the official data release from the NCUA. Don’t wait for data; contact Callahan today.