In recent quarters, credit unions have had to adapt to a new interest rate landscape. Gone are the days of rates not seen in decades; in their place, loan originations are up and the share portfolio is rebalancing. At the same time, credit unions have had to brace themselves for job market slowdowns and a K-shaped economy that gets more K-shaped every day. All while ensuring they provide the high levels of personalized service members have come to expect.
How did all of this play out in the fourth quarter? Tune into Callahan’s quarterly Trendwatch webinar at 2 p.m. ET on Tue., Feb. 24 to find out. Until then, here are a few highlights:
Takeaway 1: Loan Activity Is Picking Up
YEAR-TO-DATE LOAN ORIGINATIONS
FOR U.S. CREDIT UNIONS
SOURCE: Callahan & Associates
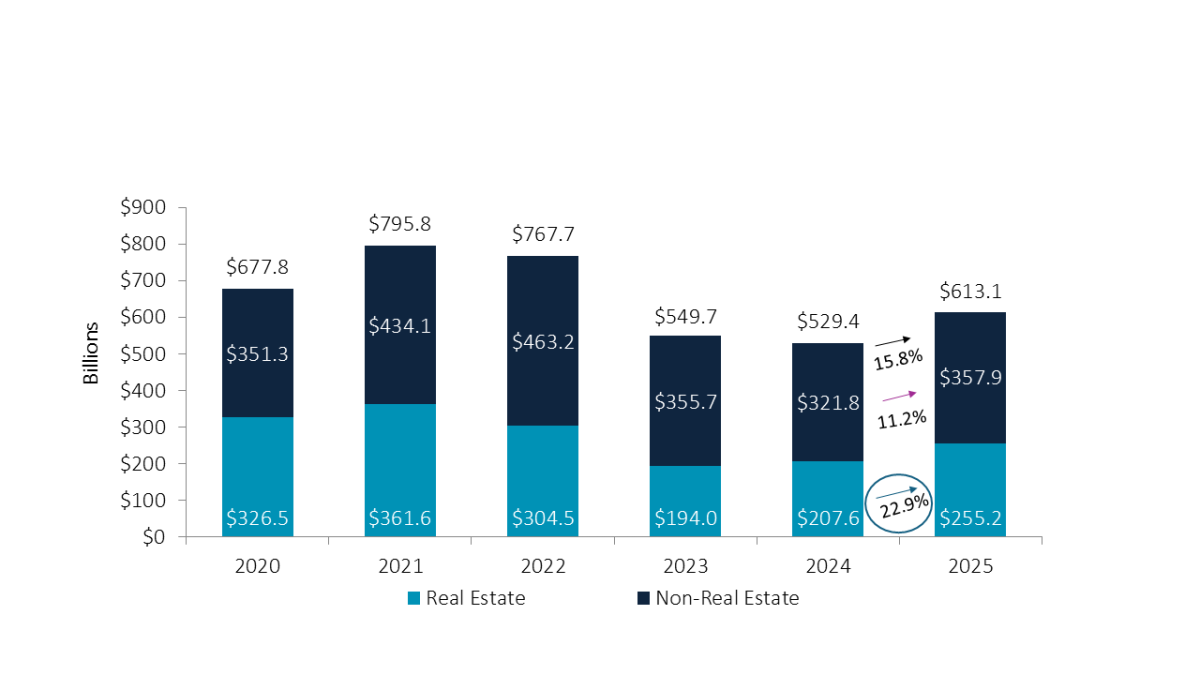
- Loan-origination activity is accelerating faster than balances, a sign that rate cuts are encouraging would-be borrowers to get off the sidelines. The 22.95% jump in first-mortgage originations (along with other real estate originations rising 15.46%) indicates borrower engagement is returning even before balances fully reflect it. This pattern typically appears when consumers anticipate lower rates ahead and begin acting on pent‑up demand.
- HELOC balances rising 15.99% and commercial loans up 11.59% signals that borrowers are selectively re‑leveraging where they see value or necessity. While some loan categories are growing, auto remains stagnant, underscoring how that segment remains rate‑sensitive and price‑constrained.
Takeaway 2: Members Are Prioritizing Liquidity
12-MONTH GROWTH IN SHARE SEGMENTS
FOR U.S. CREDIT UNIONS
SOURCE: Callahan & Associates
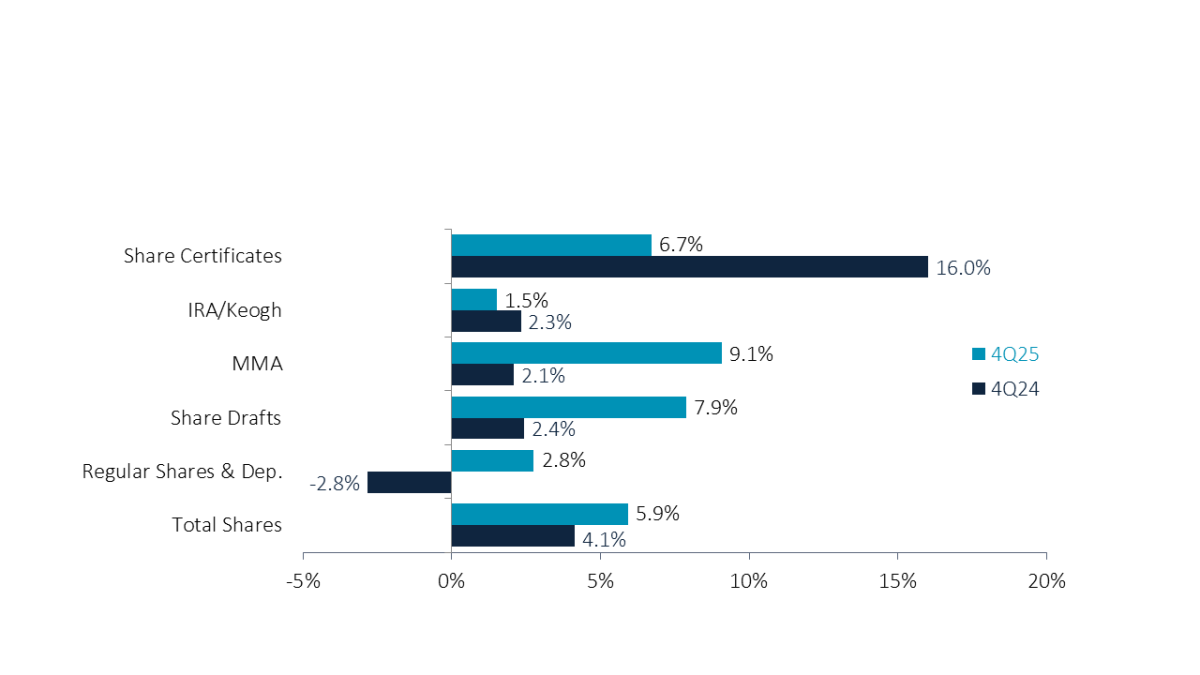
- Share certificates are losing momentum and may unwind rapidly in 2026. Despite 6.71% growth, certificates are weakening as falling rates and tighter household budgets reduce appetite for termed commitments. With 83.3% of certificates maturing within a year, credit unions face a potential remixing event in 2026 that could pressure funding costs and liquidity planning if members continue favoring short‑term options.
- Money market accounts (up 9.01%) and share drafts (up 7.83%) are capturing the bulk of new deposits, reflecting households’ desire for flexibility amid economic uncertainty. This shift also suggests that consumers are keeping cash accessible as they wait for clearer signals on rates, inflation, and employment.
 Trendwatch 4Q25. Explore fourth quarter performance trends and learn about their impact on the industry today with Callahan & Associates. Callahan hosts and industry guest presenters highlight where credit unions are excelling, where challenges are emerging, and how peers are responding. Don’t wait to gain key benchmarks, strategic takeaways, and insights to navigate 2026. Register today.
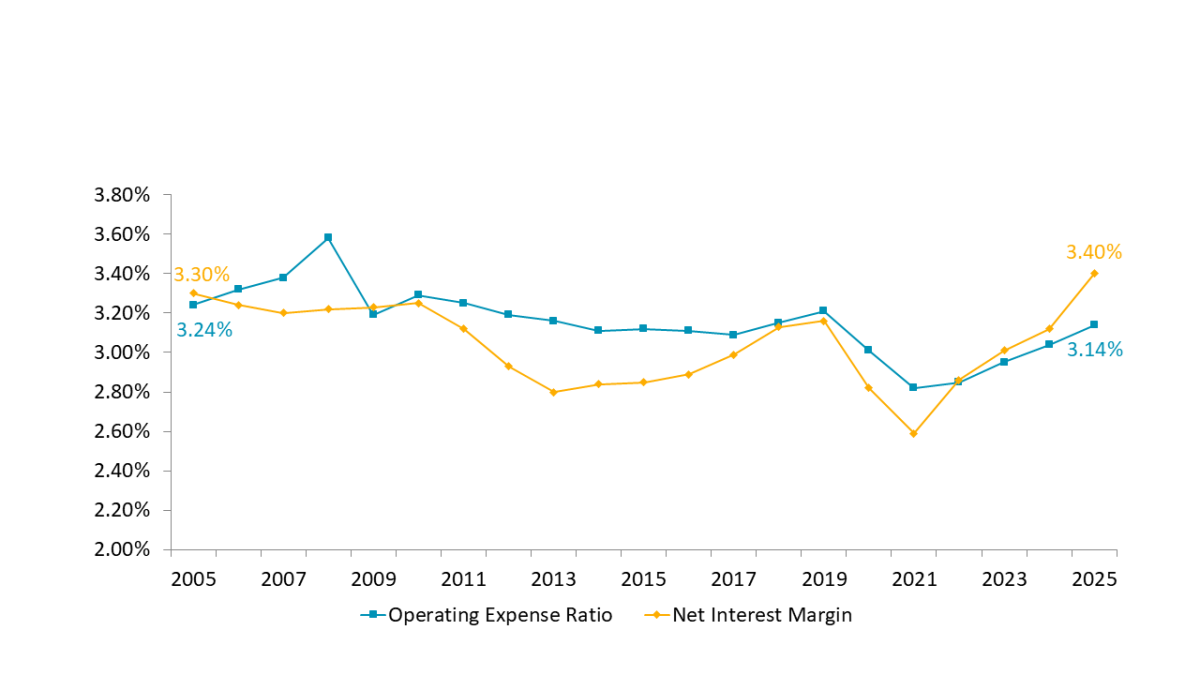
Takeaway 3: Margins Might Be Nearing A Turning Point
OPERATING EXPENSE RATIO VS NET INTEREST MARGIN
FOR U.S. CREDIT UNIONS
SOURCE: Callahan & Associates
-
- With interest rate cuts already underway, the industry is likely approaching the top of the margin cycle. Assuming rates drift lower in 2026, asset yields should begin to compress, though deposit costs may remain sticky, especially if liquidity preferences persist. The next year will test how well credit unions have positioned themselves for a cooling margin environment.
- Net income is rebounding sharply as margins stabilize at elevated levels. A projected 31.60% increase in net income — after a decline last year — highlights how effectively credit unions have capitalized on higher loan yields throughout 2025. With ROA at 0.79% and NIM holding near 3.40%, the industry is enjoying a rare window where funding costs and operating expenses have plateaued, allowing more revenue to flow directly to the bottom line.
Takeaway 4: Softer Membership Growth Could Preview Bigger Challenges
ANNUAL MEMBERSHIP GROWTH
FOR U.S. CREDIT UNIONS
SOURCE: Callahan & Associates
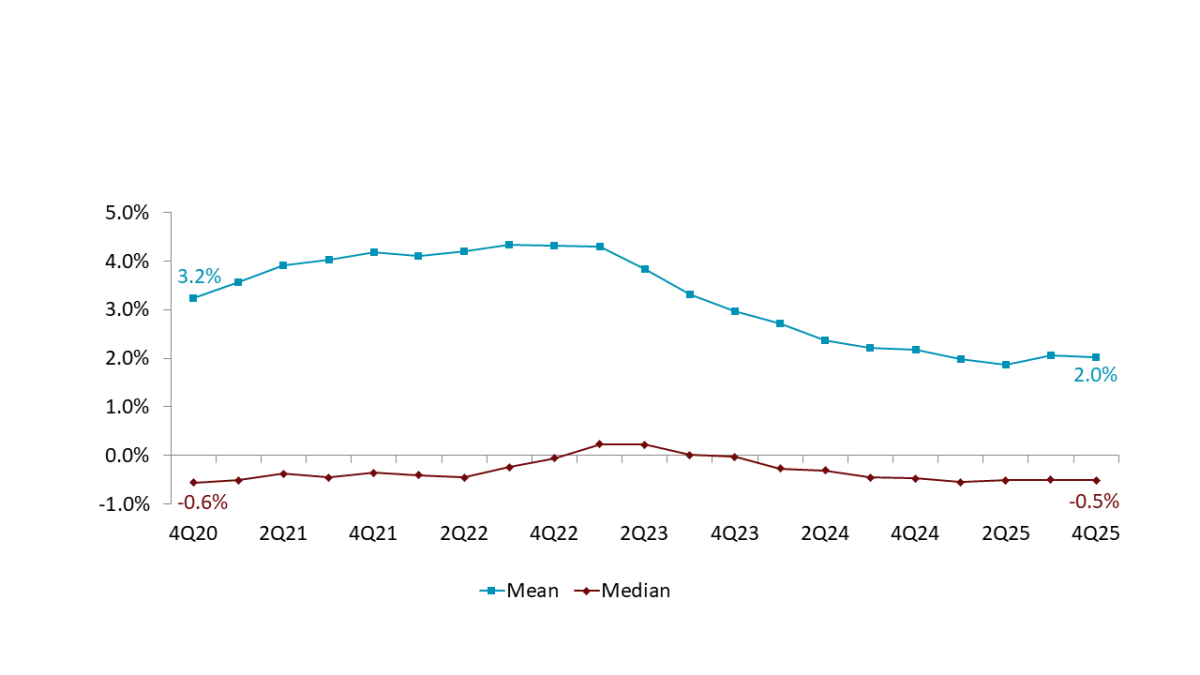
- Industrywide, growth has slowed to 2.01%, down from year end 2024, indicating credit unions are struggling to attract new members at the pace needed to sustain long term expansion. This deceleration raises questions about competitive positioning, digital acquisition strategies, and the industry’s ability to appeal to younger demographics.
- Slower member growth may limit future balance sheet momentum. To overcome this, credit unions may need to lean more heavily on deepening existing relationships rather than relying on new member inflows.
Takeaway 5: Asset Quality Is Still Troubling
ASSET QUALITY RATIO
FOR U.S. CREDIT UNIONS
SOURCE: Callahan & Associates
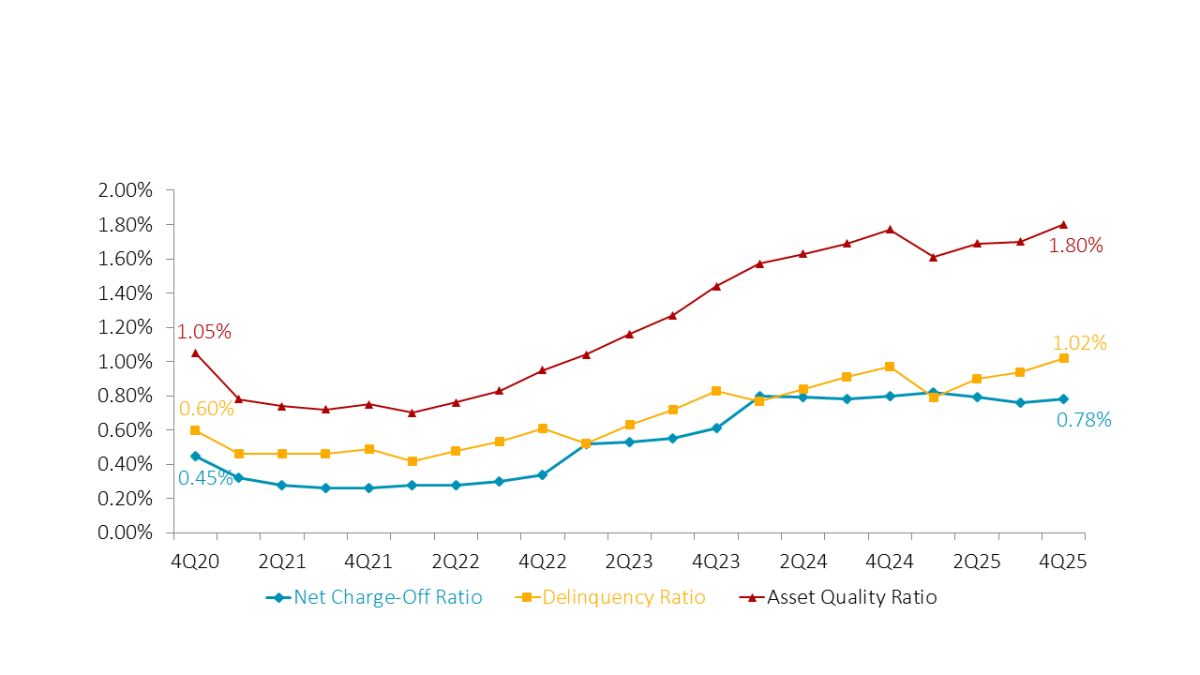
- Delinquency has reached its highest level since 2013, signaling mounting household financial stress. Overall delinquency stands at 1.02%, a decade high threshold, reflecting the cumulative strain of inflation, high borrowing costs, and stagnant wage growth.
- Revolving credit is emerging as the pressure point, with credit card losses climbing. Credit card delinquency at 2.15% and net charge offs at 4.99% show that unsecured credit is absorbing the brunt of financial stress. Even with rate relief on the horizon, the data indicates that many households are already operating at the edge of their financial capacity.
Let’s Review Your Credit Union Performance Data Together. Join a Callahan advisor for a complimentary 1:1 session to analyze your performance reports. We’ll benchmark your credit union against two to three peer groups of your choice and provide a detailed report of our findings at the end of the session to help your team make informed strategic decisions. Request your free session today.
![]() See You Next Quarter! CreditUnions.com updates this page with the freshest FirstLook credit union data every quarter, so don’t forget to come back for insights into the first quarter of 2026.
See You Next Quarter! CreditUnions.com updates this page with the freshest FirstLook credit union data every quarter, so don’t forget to come back for insights into the first quarter of 2026.