The U.S. economy is facing headwinds. The job market is cooling, hiring is weakening, and layoffs are rising. At the same time, inflation remains elevated in core necessities such as food, energy, and housing. Consumer confidence is slipping, and the reduction in federal workforce combined with an outright prolonged government shutdown has disrupted essential services and economic data reporting.
Although most top-level metrics are not signaling a recession, significant evidence points to a K-shaped economy, one in which some Americans — especially those tangential to the AI-fueled tech and finance sectors — are doing well while others — including middle- or low-income consumers most severely squeezed by tariff-driven inflation and government layoffs — struggle to make ends meet.
In times like these, members look to financial institutions they can trust, who look out for the best interest of accountholders, not shareholders. Third quarter data show credit unions are making steady, impactful progress in serving their members.
Takeaway 1: Member Growth Ticks Up
MEMBER GROWTH
FOR U.S. CREDIT UNIONS
SOURCE: Callahan & Associates
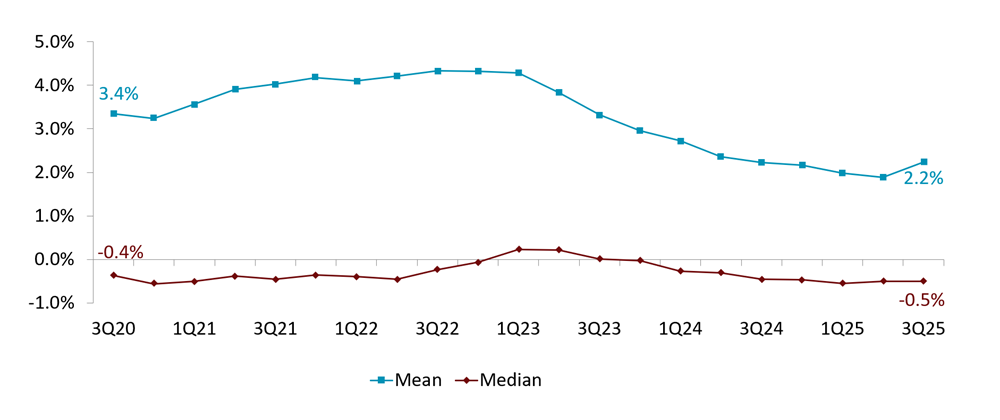
- Growing membership is the surest sign that credit unions are providing value to Americans. It shows the industry is offering in-demand products and services when for-profit institutions might be pulling back to reduce risk.
- Total industry membership growth rose to 2.2% in the third quarter, reversing a years-long trend of decelerating growth. Even more, the industry’s ongoing retreat from indirect lending suggests these additional members are poised to conduct extensive, engaged business with their institution.
- Indirect lending at credit unions dipped below 19.9% of total lending, the lowest since the end of 2021. Renewed mortgage demand helped this trend, but the drop still reflects a stronger “core” member base.
Key Takeaway 2: Loan Originations Rise Amid Rate Cuts
QUARTERLY LOAN ORIGINATIONS AND 10-YEAR TREASURY YIELD
FOR U.S. CREDIT UNIONS
SOURCE: Callahan & Associates
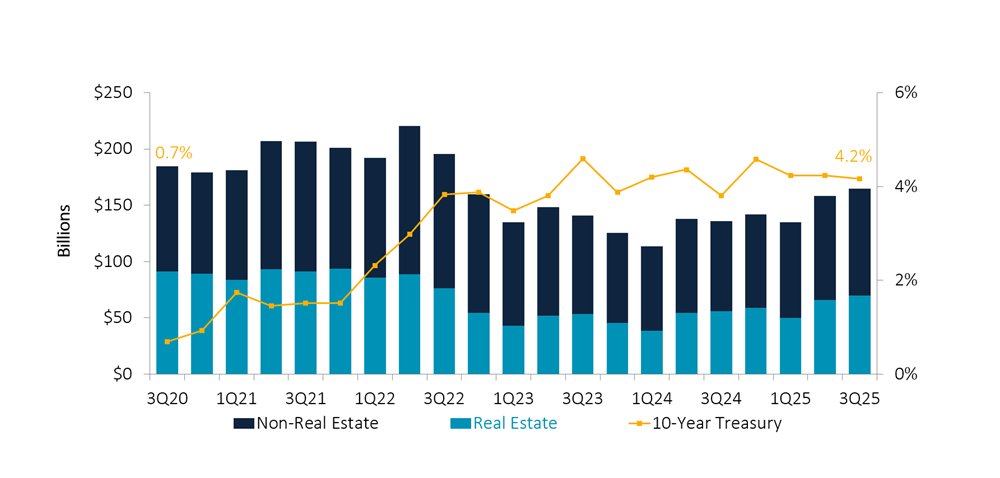
- The Federal Reserve cut rates in September and again in October, lowering the federal funds rate to 3.75% – 4.00%. In anticipation of these reductions, the 10-Year Treasury rate dropped and borrowing became cheaper.
- Members correspondingly increased borrowing in the third quarter. Originations in real estate, where lending was previously dormant, were up by 24.2% year-over-year.
- Lower rates tend to drive refinancing, an area in which credit unions thrive. As rates continue to drop, expect loan demand to further increase in that relationship-driven piece of the portfolio.
- Consumer loan originations were up 13.6% year-over-year; strong performance that increased tariffs and vehicle prices could be hindering.
 Trendwatch 3Q25. Explore third quarter performance trends and learn about their impact on the industry today with Callahan & Associates. Callahan hosts and industry guest presenters highlight where credit unions are excelling, where challenges are emerging, and how peers are responding. Don’t wait to gain key benchmarks, strategic takeaways, and insights to navigate the rest of 2025. Watch On-Demand today.
Takeaway 3: Core Members Are Deepening Relationships
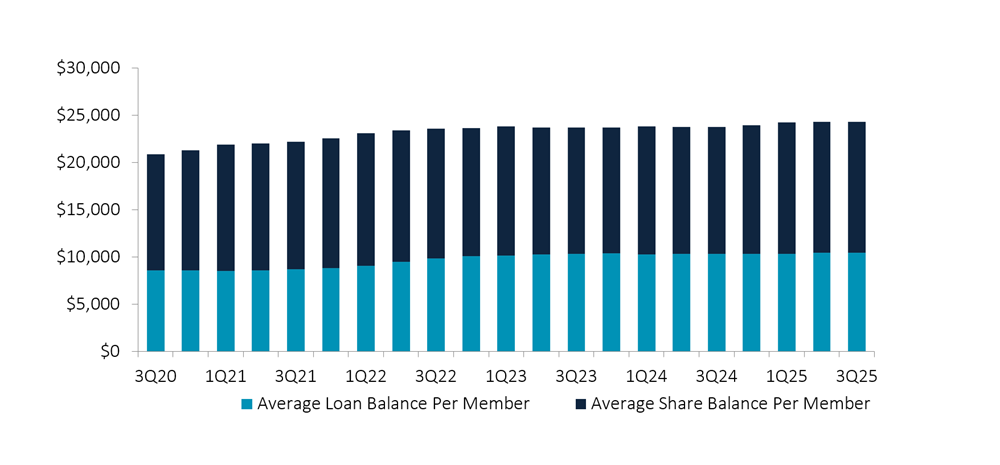
AVERAGE MEMBER RELATIONSHIP
FOR U.S. CREDIT UNIONS
SOURCE: Callahan & Associates
-
- The average member relationship remained mostly flat in the third quarter.
- Despite the fact the average share balance increased by $424, or 3.2%, year-over-year, it actually fell $38 quarter-over-quarter amid increased consumer spending.
- The average loan balance increased $31quarter-over-quarter thanks mainly to a 6.0% uptick in mortgages as members took advantage of falling interest rates.
- As more members join the movement, it can become difficult for credit unions to identify the needs of members at both the top and the bottom of the wealth bracket. Credit unions would do well to work with members on an individual basis to uncover the right opportunities.
Takeaway 4: Delinquency Rises Across All Product Types
DELINQUENCY BY PRODUCT TYPE
FOR U.S. CREDIT UNIONS
SOURCE: Callahan & Associates
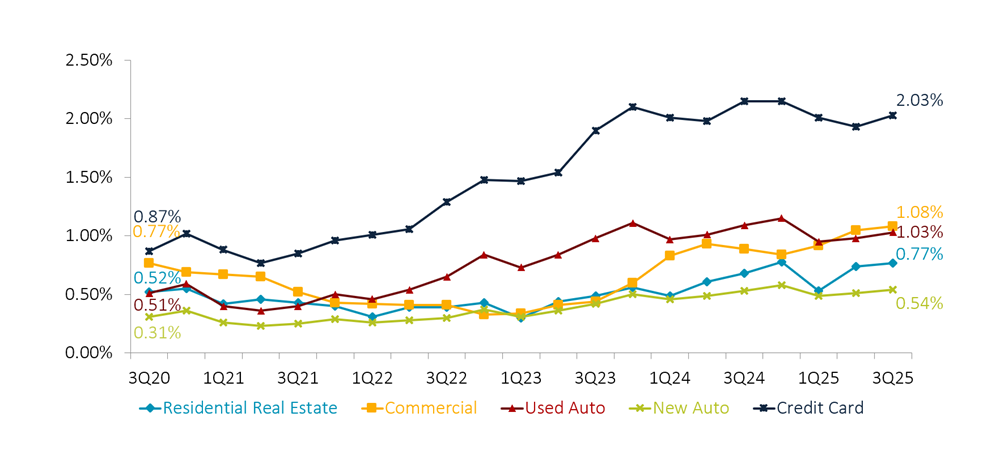
- Following fairly normal seasonality patterns, total delinquency rose 4 basis points in the third quarter to reach 0.94%.
- Credit card delinquency exceeded 2% for the first time in 2025; still, it is lower than where it was in the third quarter of 2024. A similar pattern is evident in used auto, where delinquency has risen during the year but is lower than the third quarter of 2024. Trends in consumer loan repayment indicate members are struggling but showing resiliency in the face of tariffs and inflation.
- In commercial and residential real estate, delinquency has inched up from this time last year. This is particularly worrying in residential real estate, which is a traditionally stable loan type. The bump could be signaling a return to post-2008 behavior, when borrowers walked away from their mortgage loans before others.
- Net charge-offs fell 2 basis points quarterly to 0.76%. First mortgage net charge-offs remained almost non-existent as credit unions work with members around these mortgages.
- A drop in asset quality suggests rockier roads for members and provides an opportunity for credit unions to guide and support.
Takeaway 5: Net Interest Margin Growth Outpaces Operating Expense Growth
NET INTEREST MARGIN VS. OPERATING EXPENSE RATIO
FOR U.S. CREDIT UNIONS
SOURCE: Callahan & Associates
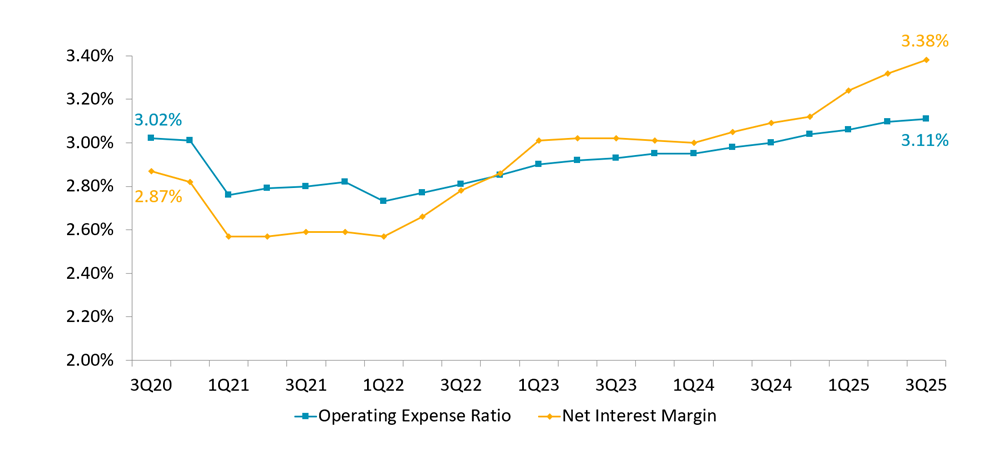
- Credit union margins took a sizable jump, hitting 3.38% on net, driven by a rise in interest income while expenses held flat. The rise in income came mainly from increased lending demand as credit unions converted more shares into higher-yielding mortgages. The cost of funds held steady 2.06%.
- Operating expenses grew slightly to 3.11%, mirroring the pace of the past few years as inflation hits the costs of doing business. All told, ROA is healthy at 0.81%
- High margins, driven by rate repricing, provide credit unions with a clear operational advantage in the near term. Interest margins have not outpaced operating expenses by such a large gap in this millennium.
- Credit unions have flexibility to help struggling members without risking long-term stability; however, rate cuts are likely to bring down interest margins in the mid-to-long term while operating costs continue an inflation-driven upward trend.
Let’s Review Your Credit Union Performance Data Together. Join a Callahan advisor for a complimentary 1:1 session to analyze your performance reports. We’ll benchmark your credit union against two to three peer groups of your choice and provide a detailed report of our findings at the end of the session to help your team make informed strategic decisions. Request your free session today.
![]() See You Next Quarter! CreditUnions.com updates this page with the freshest FirstLook credit union data every quarter, so don’t forget to come back for insights into the fourth quarter of 2025.
See You Next Quarter! CreditUnions.com updates this page with the freshest FirstLook credit union data every quarter, so don’t forget to come back for insights into the fourth quarter of 2025.